. 2006 Dec;143(3):779-92.
doi: 10.1016/j.neuroscience.2006.08.079. Epub 2006 Oct 30.

Acute and chronic changes in aquaporin 4 expression after spinal cord injury

Affiliations

Acute and chronic changes in aquaporin 4 expression after spinal cord injury

O Nesic et al. Neuroscience. 2006 Dec.

Abstract

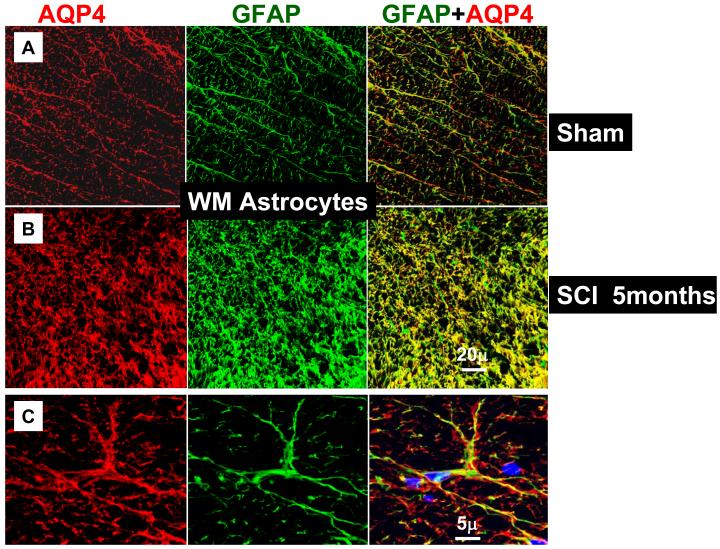
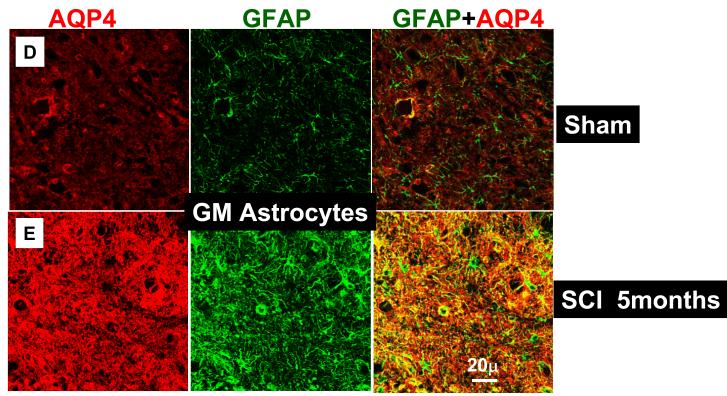
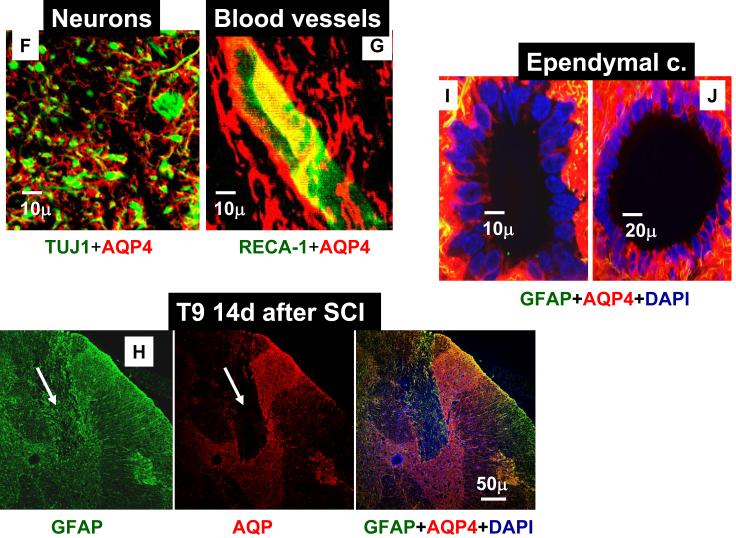
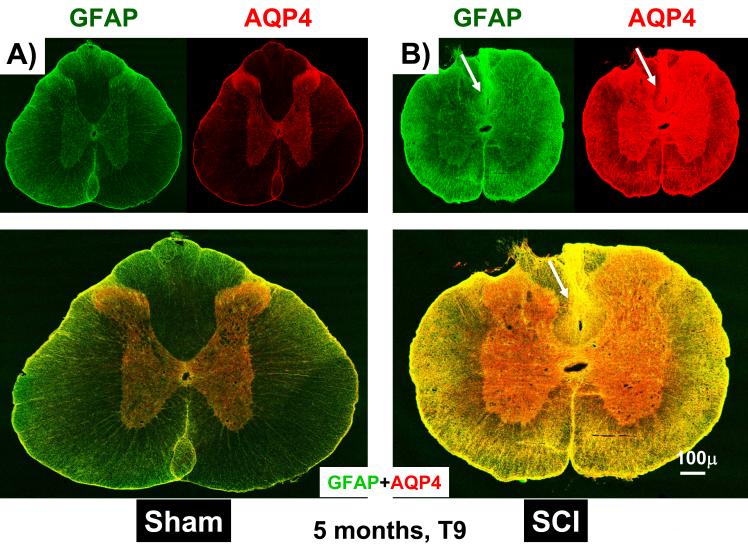
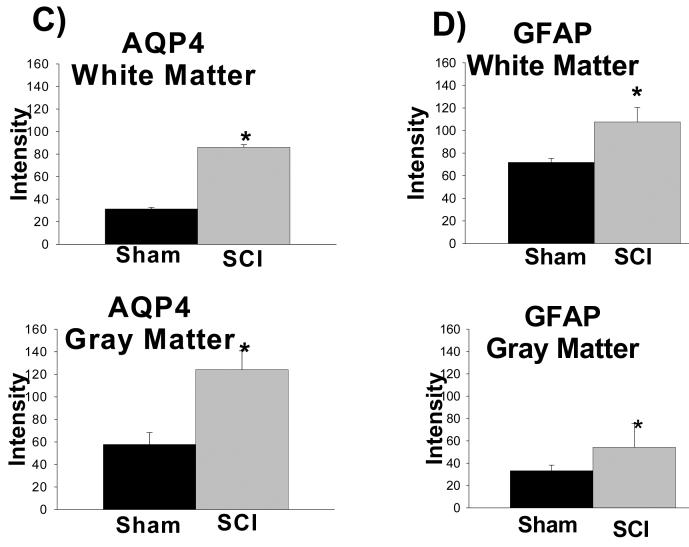
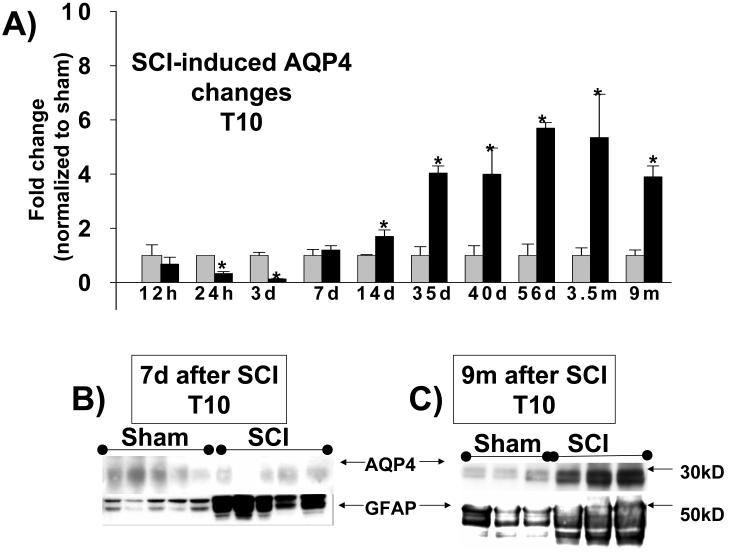
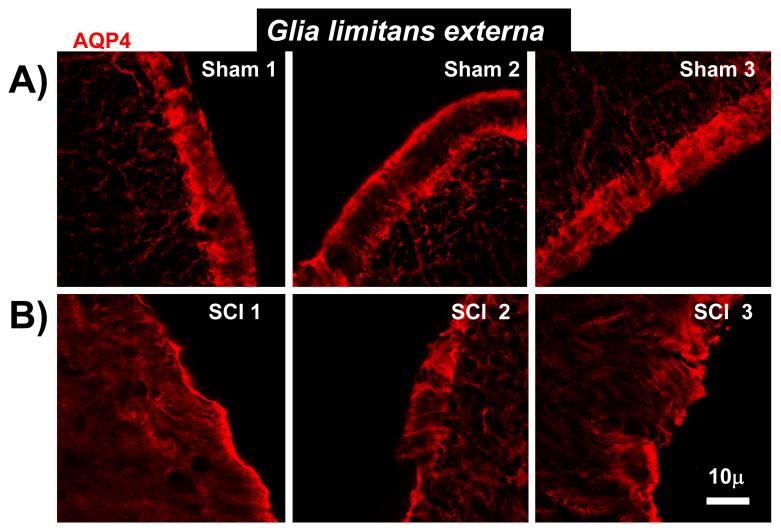
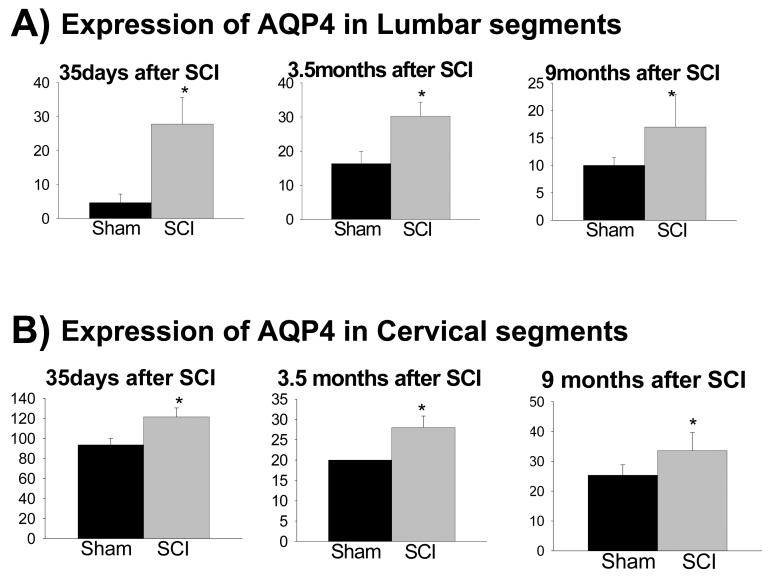
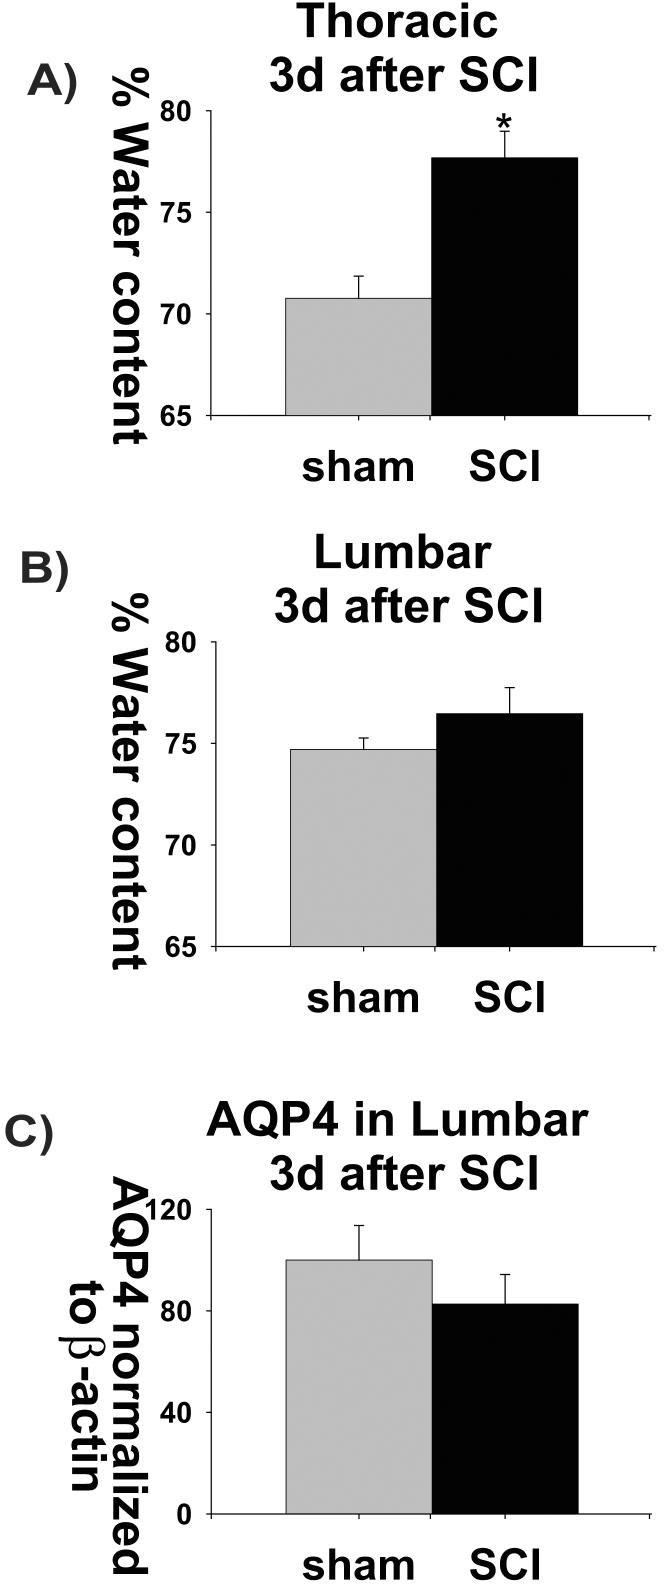
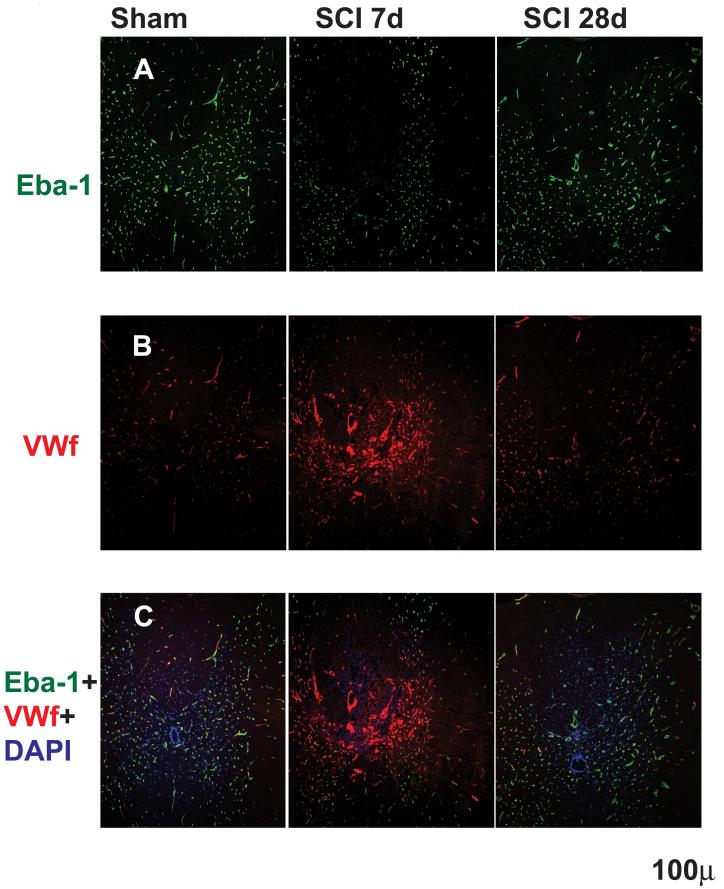
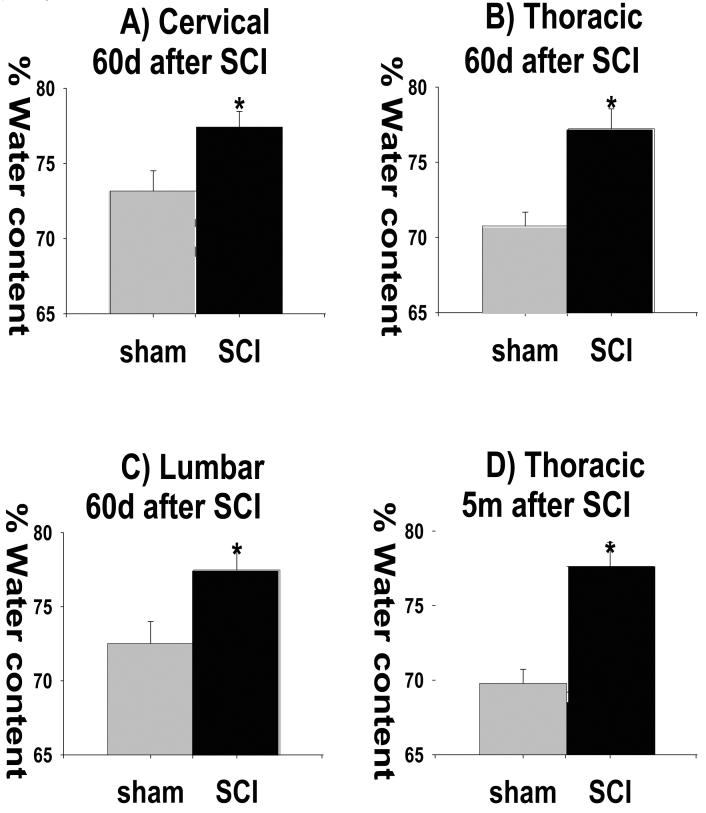
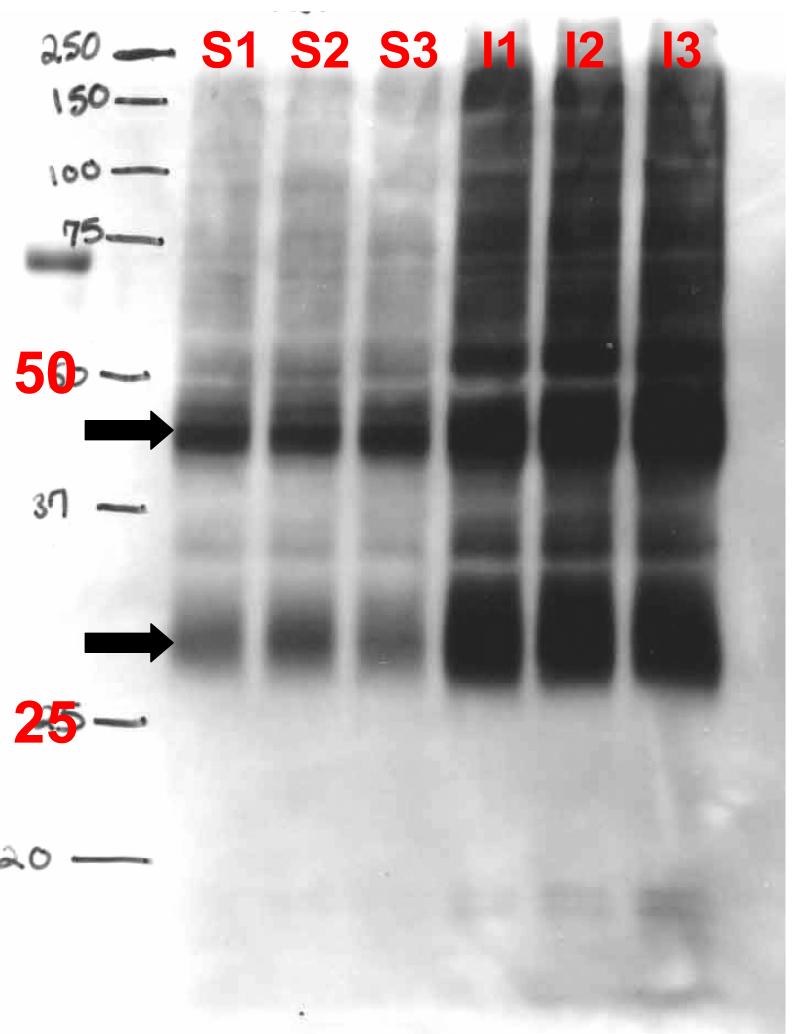
The effect of spinal cord injury (SCI) on the expression levels and distribution of water channel aquaporin 4 (AQP4) has not been studied. We have found AQP4 in gray and white matter astrocytes in both uninjured and injured rat spinal cords. AQP4 was detected in astrocytic processes that were tightly surrounding neurons and blood vessels, but more robustly in glia limitans externa and interna, which were forming an interface between spinal cord parenchyma and cerebrospinal fluid (CSF). Such spatial distribution of AQP4 suggests a critical role that astrocytes expressing AQP4 play in the transport of water from blood/CSF to spinal cord parenchyma and vice versa. SCI induced biphasic changes in astrocytic AQP4 levels, including its early down-regulation and subsequent persistent up-regulation. However, changes in AQP4 expression did not correlate well with the onset and magnitude of astrocytic activation, when measured as changes in GFAP expression levels. It appears that reactive astrocytes began expressing increased levels of AQP4 after migrating to the wound area (thoracic region) two weeks after SCI, and AQP4 remained significantly elevated for months after SCI. We also showed that increased levels of AQP4 spread away from the lesion site to cervical and lumbar segments, but only in chronically injured spinal cords. Although overall AQP4 expression levels increased in chronically-injured spinal cords, AQP4 immunolabeling in astrocytic processes forming glia limitans externa was decreased, which may indicate impaired water transport through glia limitans externa. Finally, we also showed that SCI-induced changes in AQP4 protein levels correlate, both temporally and spatially, with persistent increases in water content in acutely and chronically injured spinal cords. Although correlative, this finding suggests a possible link between AQP4 and impaired water transport/edema/syringomyelia in contused spinal cords.


Figures

Fig. 1
Fig. 1
Astrocytic localization of AQP4- Co-localization of AQP4 and GFAP. A) Sham-treated spinal cords. AQP4 (red) and GFAP (green) immunolabeling in the white matter of the sham-treated spinal cords (T9; 5 months after sham treatment; n=3). Yellow color in the merged image represents co-localization of AQP4 and GFAP. B) Injured spinal cords. AQP4 and GFAP immunolabeling in white matter of the injured spinal cord (T9; isolated 5 months after SCI; n=3) also showed complete co-localization. C) High magnification image of a GFAP-labeled cell that expresses AQP4 in sham-treated spinal cords, 5m after sham treatment in T9 shows AQP4 that overlaps with GFAP immunolabeling, but also AQP4 labeling that likely shows astrocytic processes not stained with GFAP. D), E) AQP4 and GFAP immunolabeling in the gray mater of sham (C; n=3) and injured spinal cords (D; n=3) in T9 section, 5 months after SCI. F) TUJ1 immunolabeling against beta-tubulin (green) illustrates how tightly astrocytic processes expressing AQP4 (red) surrounded neurites in uninjured spinal cords (T9; n=3). G) RECA-1 immunolabeling (endothelial cell marker, green) showed a close proximity of astrocytic processes expressing AQP4 and blood vessels in uninjured spinal cords (T9; n=3), similarly to injured spinal cords (not shown; n=6). H) Astrocytes not expressing AQP4. GFAP-positive cells that are present in the damaged area of spinal cords, 14 days after SCI (in T9 segment) do not express AQP4 (marked with white arrow). In sham samples at different time points after sham treatment we have not found GFAP-positive cells that did not express AQP4. I, J) AQP4 in ependymal cells. AQP4 was also expressed in ependymal cells surrounding the central canal in sham (H), or injured (I) spinal cords in T9, 5 months after SCI (n=3), but with lower intensity than in astrocytes. AQP4 was visible in the apical part of cells, facing the central canal.
Fig. 1
Fig. 1
Astrocytic localization of AQP4- Co-localization of AQP4 and GFAP. A) Sham-treated spinal cords. AQP4 (red) and GFAP (green) immunolabeling in the white matter of the sham-treated spinal cords (T9; 5 months after sham treatment; n=3). Yellow color in the merged image represents co-localization of AQP4 and GFAP. B) Injured spinal cords. AQP4 and GFAP immunolabeling in white matter of the injured spinal cord (T9; isolated 5 months after SCI; n=3) also showed complete co-localization. C) High magnification image of a GFAP-labeled cell that expresses AQP4 in sham-treated spinal cords, 5m after sham treatment in T9 shows AQP4 that overlaps with GFAP immunolabeling, but also AQP4 labeling that likely shows astrocytic processes not stained with GFAP. D), E) AQP4 and GFAP immunolabeling in the gray mater of sham (C; n=3) and injured spinal cords (D; n=3) in T9 section, 5 months after SCI. F) TUJ1 immunolabeling against beta-tubulin (green) illustrates how tightly astrocytic processes expressing AQP4 (red) surrounded neurites in uninjured spinal cords (T9; n=3). G) RECA-1 immunolabeling (endothelial cell marker, green) showed a close proximity of astrocytic processes expressing AQP4 and blood vessels in uninjured spinal cords (T9; n=3), similarly to injured spinal cords (not shown; n=6). H) Astrocytes not expressing AQP4. GFAP-positive cells that are present in the damaged area of spinal cords, 14 days after SCI (in T9 segment) do not express AQP4 (marked with white arrow). In sham samples at different time points after sham treatment we have not found GFAP-positive cells that did not express AQP4. I, J) AQP4 in ependymal cells. AQP4 was also expressed in ependymal cells surrounding the central canal in sham (H), or injured (I) spinal cords in T9, 5 months after SCI (n=3), but with lower intensity than in astrocytes. AQP4 was visible in the apical part of cells, facing the central canal.
Fig. 2
Fig. 2
AQP4 immunolabeling increases in chronically injured spinal cords. A) A representative example of GFAP (green) and AQP4 (red) immunolabeling in sham-treated spinal cords (T9), extracted 5 months after sham treatments. B) A representative example of GFAP (green) and AQP4 (red) immunolabeling in injured spinal cords (T9), 5 months after SCI. C) Semi-quantitative analysis of the intensity of AQP4 immunolabeling, in gray and white matter, before and after SCI (n=3 per group). D) Semi-quantitative analysis of the intensity of GFAP immunolabeling, in gray and white matter, before and after SCI (n=3 per group). (Mean +/− SD; p<0.05.).
Fig. 2
Fig. 2
AQP4 immunolabeling increases in chronically injured spinal cords. A) A representative example of GFAP (green) and AQP4 (red) immunolabeling in sham-treated spinal cords (T9), extracted 5 months after sham treatments. B) A representative example of GFAP (green) and AQP4 (red) immunolabeling in injured spinal cords (T9), 5 months after SCI. C) Semi-quantitative analysis of the intensity of AQP4 immunolabeling, in gray and white matter, before and after SCI (n=3 per group). D) Semi-quantitative analysis of the intensity of GFAP immunolabeling, in gray and white matter, before and after SCI (n=3 per group). (Mean +/− SD; p<0.05.).
Fig. 3
Fig. 3
Time course of AQP4 expression changes after SCI. A) Quantitative analyses of immunoblotted AQP4 expression (Western blots) in uninjured and injured spinal cords (at the site of injury:T10) at different time points after SCI: 12h (n=5 for both sham and SCI), 24h (n=6 for both sham and SCI), 72h (n=5 for both sham and SCI), 7 d (n=5 for both sham and SCI); 14d (n=3 for both sham and SCI); 35 d (n= 12 for both sham and SCI); 40d (n=3 for sham and n=4 for SCI); 56d (n=4 for sham and n=5 for SCI) and 3.5 mo ( n=3 for sham and n=5 for SCI) and 9 mon (9m; n=6 for sham n=6 for SCI), shown as equidistant points on the X-axis. The Y-axis represents the relative intensity of the 30kD AQP4 band normalized to β-actin, and than to sham values (set to =1). AQP4 protein levels showed significant down-regulation in the first week after SCI, but robust and chronic up-regulation in the months after SCI (Bonferroni multiple comparisons tests; *=p<0.05). Representative AQP4 Western blots were shown above bar graphs for two sham samples (S1, S2) and two injured samples (I1, I2) for chronically injured spinal cords. B) Representative examples of AQP4 and GFAP Western blots 12h after SCI showed a significant increase in GFAP expression (∼50 kD), and no change for AQP4 expression in five injured samples (SCI) in T10. C) A representative example of AQP4 and GFAP Western blots 9 months after SCI show significant 4 fold increases in AQP4 expression (see Fig. 3A), and 1.4 fold increases in GFAP in injured T10. p<0.05. (Mean +/− SD).
Fig. 4
Fig. 4
Decreased AQP4 in Glia limitans externa. A) Representative examples of AQP4 immunolabeling in glia limitans externa in three sham-treated spinal cords, 5 months after the sham treatment (T9 segments). The images were taken in three different regions of uninjured spinal sections (dorsal and ventral horns). B) Representative examples of AQP4 immunolabeling in glia limitans in three contused spinal cords, 5 months after SCI. (in corresponding regions to T9 spinal sections presented in A; n=3).
Fig. 5
Fig. 5
AQP4 expression changes spread to cervical and lumbar segments. Quantitative Western blot analysis showed significantly higher expression levels of AQP4 in: A) lumbar (consisting of pooled L4 and L5 segments), and B) cervical regions (consisting of pooled C7 and C8 segments), at 35d (n=3 for sham and n=5 for SCI), 3.5 months (n=3 for sham and n=5 for SCI) and 9 months after SCI. (n=3 for sham and n=5 for SCI; p<0.05. (Mean +/− SD).
Fig. 6
Fig. 6
Increased water content in acutely injured spinal cords spatially and temporally correlate with AQP4 expression changes. A) The water content was significantly increased (6%) in the thoracic spinal region 3 days after SCI. Three thoracic segments (T9+T10+T11) from sham-treated (n=4) and injured spinal cords (n=5) were pooled and water content measured using dry weight method. B) Water content was also measured in lumbar (L4+L5 pooled) of sham-treated (n= 4) and injured spinal cords (n=5). There was no change in the water content 3d after SCI in the lumbar or cervical regions (C7+C8 pooled; not shown n=the same as in lumbar). C) AQP4 expression levels were measured in L4+L5, also at 3d after SCI, using Western blot analysis (n=5 for both sham and SCI).
Fig. 7
Fig. 7
Blood spinal cord barrier (BSCB) breakdown and recovery after SCI. A) Top panel: Eba-1 (Endothelial barrier antigen) immunolabeling in sham spinal cord segment T9 (left column; n=3) and in injured T9 segment, 7 (middle column; n=3) and 28d after SCI (right column; n=3). There were visible decreases in Eba-1 staining in injured spinal cords 7d after SCI, but not at 28d after SCI, suggesting disruption of BSCB properties at 7d and recovery at 28d after SCI. B) Middle panel: Von Willebrandt factor labeling of endothelial cells, in sham spinal cord segment T9 and in injured T9 7d after SCI and 28d after SCI (the same sections used in A). Von Willebrand factor labeling increases at 7d after SC indicated angiogenesis and formation of newly formed blood vessels, in agreement with other reports. C) Bottom panel: Images show dual labeling of Eba-1 and vWf in the same sections as presented in above pictures. The absence of co-localization of the vWf and Eba-1 labeling in the putative new blood vessels (intense red vWf staining around the site of injury in the dorsal horns) suggests that newly formed blood vessels after SCI do not form BSCB at 7d, but, they mature by day 28 post-injury, and Eba-1 expression appears and co-localizes with vWf labeling.
Fig. 8)
Fig. 8)
Increased water content in chronically injured spinal cords. A-C) Water content was also increased 2 months after SCI in all three spinal regions, cervical (C7+C8), thoracic (T9+T10+T11) and lumbar (L4+L5; n=7 for sham and n=11 for SCI; Mean +/− SD; p<0.05). D) Water content increases in injured spinal cords 5 months after SCI (n=7 for sham and n=11 for SCI; Mean +/− SD; p<0.05).
Fig. M1
Fig. M1
Representative AQP4 Western blot showing several bands, the most intense at ∼30kD and ∼45 kD (arrow), in three sham samples (S1-S3) and three injured samples (I1-I3) 46d after SCI (T10).

Similar articles

Cited by

References

    1. Agre L.S. King, Yasui M, Guggino WB, Ottersen OP, Fujiyoshi Y, Engel A, Nielsen S. Aquaporin water channels–from atomic structure to clinical medicine. J Physiol. 2002;542:3–16. - PMC - PubMed
    1. Amiry-Moghaddam M, Ottersen OP. The molecular basis of water transport in the brain. Nat Rev Neurosci. 2003;4:991–1001. - PubMed
    1. Amiry-Moghaddam M, Xue R, Haug FM, Neely JD, Bhardwaj A, Agre P, Adams ME, Froehner SC, Mori S, Ottersen OP. Alpha-syntrophin deletion removes the perivascular but not endothelial pool of aquaporin-4 at the blood-brain barrier and delays the development of brain edema in an experimental model of acute hyponatremia. FASEB J. 2004 Mar;18(3):542–4. - PubMed
    1. Badaut J, Lasbennes F, Magistretti PJ, Regli L. Aquaporins in brain: distribution, physiology, and pathophysiology. J Cereb Blood Flow Metab. 2002 Apr;22(4):367–78. - PubMed
    1. Basso DM, Beattie MS, Bresnahan JC. Graded histological and locomotor outcomes after spinal cord contusion using NYU weight drop device versus transection. Exp. Neurol. 1996;139:244–256. - PubMed

Publication types

MeSH terms