. 2007 Jan;27(2):497-509.
doi: 10.1128/MCB.01772-06. Epub 2006 Oct 30.

Calcium-dependent regulation of NEMO nuclear export in response to genotoxic stimuli

Affiliations

Calcium-dependent regulation of NEMO nuclear export in response to genotoxic stimuli

Craig M Berchtold et al. Mol Cell Biol. 2007 Jan.

Abstract

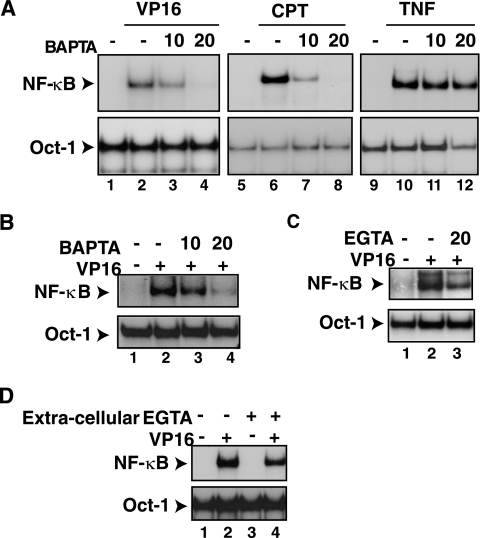
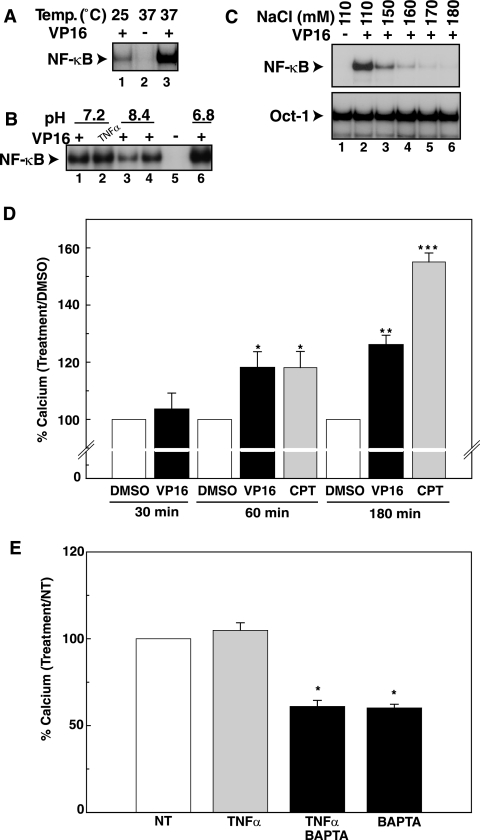
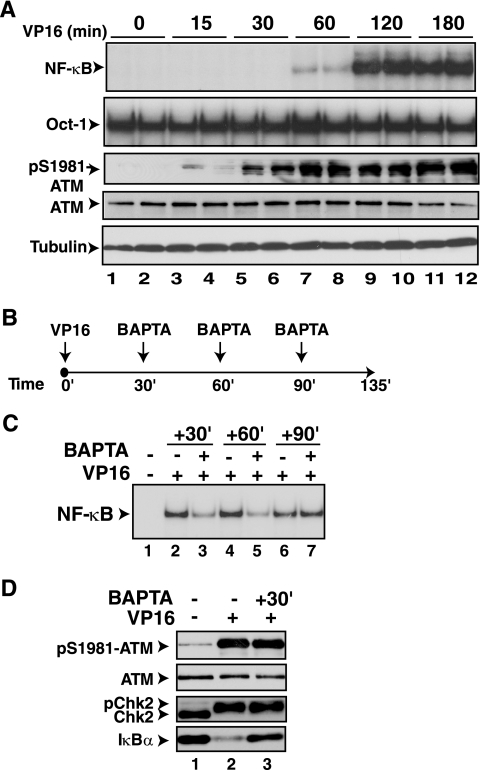
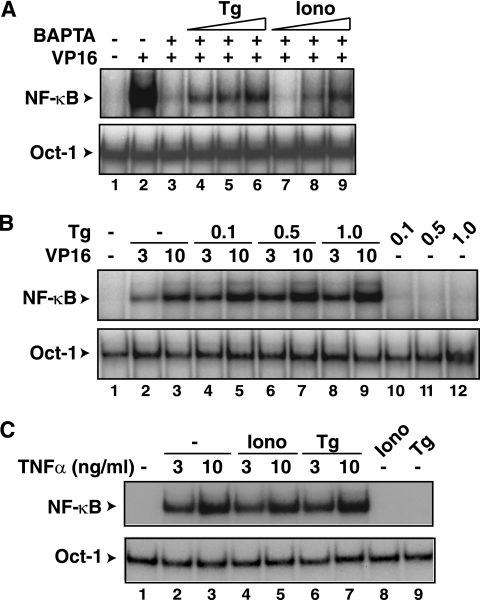
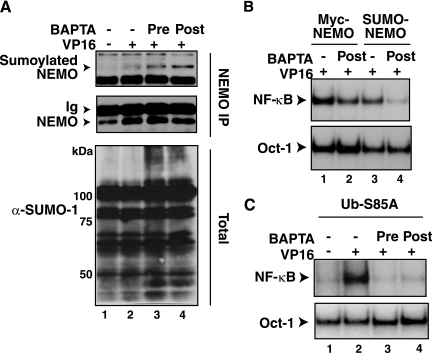
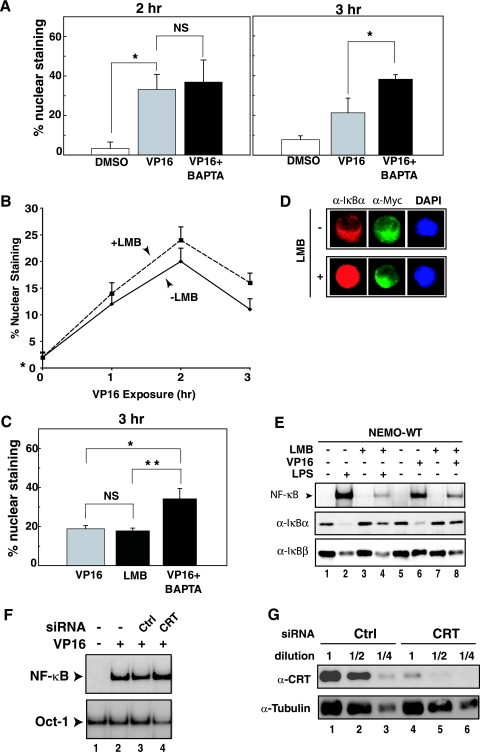
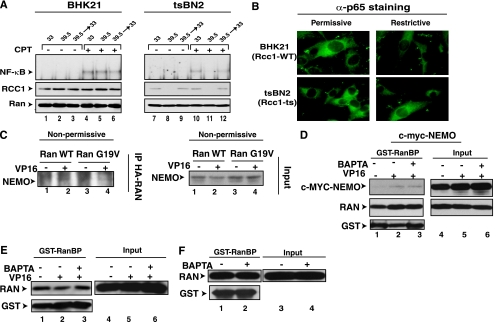
The mechanisms involved in activation of the transcription factor NF-kappaB by genotoxic agents are not well understood. Previously, we provided evidence that a regulatory subunit of the IkappaB kinase (IKK) complex, NF-kappaB essential modulator (NEMO)/IKKgamma, is a component of a nuclear signal that is generated after DNA damage to mediate NF-kappaB activation. Here, we found that etoposide (VP16) and camptothecin induced increases in intracellular free calcium levels at 60 min after stimulation of CEM T leukemic cells. Inhibition of calcium increases by calcium chelators, BAPTA-AM and EGTA-AM, abrogated NF-kappaB activation by these agents in several cell types examined. Conversely, thapsigargin and ionomycin attenuated the BAPTA-AM effects and promoted NF-kappaB activation by the genotoxic stimuli. Analyses of nuclear NEMO levels in VP16-treated cells suggested that calcium was required for nuclear export of NEMO. Inhibition of the nuclear exporter CRM1 by leptomycin B did not interfere with NEMO nuclear export. Similarly, deficiency of a plausible calcium-dependent nuclear export receptor, calreticulin, failed to prevent NF-kappaB activation by VP16. However, temperature inactivation of the Ran guanine nucleotide exchange factor RCC1 in the tsBN2 cell line harboring a temperature-sensitive mutant of RCC1 blocked NF-kappaB activation induced by genotoxic stimuli. Overexpression of Ran in this cell model showed that DNA damage stimuli induced formation of a complex between Ran and NEMO, suggesting that RCC1 regulated NF-kappaB activation through the modulation of RanGTP. Indeed, evidence for VP16-inducible interaction between Ran-GTP and NEMO could be obtained by means of glutathione S-transferase (GST) pull-down assays using GST fused to the Ran binding domain of RanBP2, which specifically interacts with the GTP-bound form of Ran. BAPTA-AM did not alter these interactions, suggesting that calcium is a necessary step beyond the formation of a Ran-GTP-NEMO complex in the nucleus. These results suggest that calcium has a unique role in genotoxic stress-induced NF-kappaB signaling by regulating nuclear export of NEMO subsequent to the formation of a nuclear export complex composed of Ran-GTP, NEMO, and presumably, an undefined nuclear export receptor.


Figures

FIG. 1.
FIG. 1.
BAPTA-AM inhibits NF-κB activation by VP16 and CPT. (A) HEK293 cells were exposed to BAPTA-AM (μM) 30 min prior to addition of VP16 (10 μM, 2 h), CPT (10 μM, 2 h) or TNF-α (10 ng/ml, 15 min). Total cell extracts were prepared and analyzed by EMSA using an NF-κB probe (upper panels) or a Oct-1 probe (lower panels). The statistical analysis used analysis of variance for multiple comparisons and Tukey's test for multiple paired analysis. The gels represent results from one of three individual experiments. (B) A similar experiment as in panel A was performed using the CEM T leukemic cell line. (C) A similar experiment as in panel A was performed using the CEM T leukemic cell line with EGTA-AM treatment. (D) HEK293 cells were exposed to EGTA (3 mM) 30 min prior to the addition of VP16 and analyzed as in panel A.
FIG. 2.
FIG. 2.
CPT and VP16 cause significant increases in steady-state calcium levels. (A) HEK293 cells were incubated either at 25°C or 37°C and exposed to VP16 (10 μM, 2 h) and analyzed by EMSA for NF-κB activation. +, present; −, absent. (B) HEK293 cells were incubated in buffers with different pHs as described in Materials and Methods and exposed to VP16 (10 μM) or TNF-α (10 ng/ml) for 2 h for EMSA of NF-κB activation. (C) HEK293 cells were incubated in different salt concentrations and exposed to VP16 (10 μM, 2 h) for EMSA of NF-κB activation. The results were analyzed according to Fig. 1A. (D) CEM cells were preloaded with INDO-1-AM and exposed to the DMSO vehicle control, VP16 (10 μM), or CPT (10 μM) for the indicated times. At the end of each time point, intracellular calcium levels were estimated according to the method described in Materials and Methods. The data from Table 1 are depicted as the percent increase over DMSO-vehicle calcium values at 30, 60, and 180 min with VP16 (10 μM) and/or CPT (10 μM) treatment. The bar graph analysis depicts the estimated steady-state calcium concentrations relative to the DMSO-vehicle values times 100. Each bar is the average ± SD of results from three independent experiments at each time depicted on the graph. (E) CEM cells were preloaded with INDO-1-AM and exposed to TNF-α (10 ng/ml) and other treatments for 15 min. The intracellular calcium levels were estimated as described in Materials and Methods. The data from Table 2 are depicted as the percent increase or decrease over NT calcium values at 15 min with TNF-α (10 ng/ml) and BAPTA-AM (20 μM) treatment. The bar graph analysis depicts the estimated steady-state calcium concentrations relative to the NT values times 100. Each bar is the average ± SD of results from three independent experiments.
FIG. 3.
FIG. 3.
BAPTA-AM exerts NF-κB inhibitory effects up to 60 min after VP16 exposure. (A) HEK293 cells were exposed to VP16 (10 μM) and processed at the indicated time points in duplicate. The proteins were analyzed by EMSA for NF-κB activation and by Western blot analysis with antibodies to pS1981-ATM, ATM, and α-tubulin. (B) Diagram depicting the treatment protocol used to apply BAPTA-AM after VP16 exposure. (C) HEK293 cells were exposed to VP16 (10 μM) and BAPTA-AM (30 μM) as depicted in panel C and analyzed by EMSA for NF-κB activation. The results were analyzed according to the method described for Fig. 1A. (D) HEK293 cells were exposed to BAPTA-AM (30 μM) 30 min after the addition of VP16 (10 μM) and processed for Western blot analyses with antibodies to pS1981-ATM, ATM, ChK2, and IκBα. The results were quantified by Image J software and analyzed according to the method described for Fig. 1A.
FIG. 4.
FIG. 4.
Thapsigargin and ionomycin reverse the NF-κB inhibitory effects of BAPTA-AM. (A) HEK293 cells treated with VP16 (lane 2) for 2 h were cotreated with BAPTA-AM (30 μM) (lane 3) at 30 min in the absence (−) or presence (+) of increasing amounts of thapsigargin (Tg) at 0.1 μM (lane 4), 0.5 μM (lane 5), or 1.0 μM (lane 6) or ionomycin (Iono) at 0.1 μM (lane 7), 0.5 μM (lane 8), and 1.0 μM (lane 9). DMSO-treated cells (lane 1) were used as controls. The cells were processed for NF-κB activation and the Oct-1 loading control. (B) HEK293 cells were exposed to VP16 (3 or 10 μM) in the absence or presence of increasing amounts of thapsigargin (Tg, μM) for EMSA of NF-κB activation and an Oct-1 loading control. Cells exposed only to thapsigargin were also analyzed in parallel. (C) HEK293 cells were exposed to TNF-α (3 or 10 ng/ml) in the absence or presence of ionomycin (Iono, 1.0 μM) or thapsigargin (Tg, 0.1 μM) for EMSA of NF-κB activation and an Oct-1 loading control. Cells exposed only to ionomycin or thapsigargin were also analyzed in parallel.
FIG. 5.
FIG. 5.
BAPTA-AM does not inhibit NEMO sumoylation induced by VP16 and inhibits NF-κB activation mediated by SUMO-NEMO and Ub-S85A-NEMO fusion proteins. (A) CEM cells were treated with VP16 (10 μM) for 1 h with (+) or without (−) BAPTA-AM (30 μM, 30 min) treatment or pretreatment (20 μM) and processed as described in Materials and Methods for NEMO immunoprecipitation and Western blot analysis with anti-SUMO-1 (α-SUMO-1) antibody and anti-NEMO for a control. Total cell extracts were also analyzed by anti-SUMO-1 antibody as an additional control. (B) 1.3E2 NEMO-deficient murine pre-B cells stably reconstituted with Myc-NEMO or SUMO-NEMO proteins were treated with VP16 (10 μM) for 2 h with or without BAPTA-AM (10 μM, 30 min) treatment or pretreatment (20 μM) for EMSA of NF-κB activation and an Oct-1 control. The results were analyzed according to the method described for Fig. 1A. (C) 1.3E2 cells stably reconstituted with Ub-S85A-NEMO protein were treated with VP16 (10 μM) for 2 h with or without BAPTA-AM (10 μM, 30′) treatment or pretreatment for EMSA of NF-κB activation and an Oct-1 control. The results were analyzed according to the method described for Fig. 1A.
FIG. 6.
FIG. 6.
NEMO nuclear export induced by VP16 treatment is blocked by BAPTA-AM. (A) 1.3E2 cells stably expressing Myc-NEMO were plated on a glass coverslip overnight and then exposed to VP16 (10 μM) for 2 or 3 h, with coexposure to BAPTA-AM (30 μM) given 30 min after VP16 exposure. Cells were fixed and stained with anti-Myc (α-Myc) antibody (9E10) as the primary antibody and fluorescein isothiocyanate-labeled secondary anti-mouse antibody to examine nuclear localization of NEMO. 4′,6′-Diamidino-2-phenylindole (DAPI) staining was used for nuclear staining. The bar graph represents the average ± SD of results from three independent experiments each at 2 h and 3 h for the percentage of cells displaying nuclear NEMO staining. Each experiment consisted of counting at least 300 individual cells from multiple areas on the slide. Analysis of variance determined that there was a statistically significant difference among the means of the different treatment groups (P < 0.01) at 2 h. The Tukey's multiple paired analysis determined that there was a statistically significant difference between the means of the DMSO-vehicle and VP16 (*, P < 0.05) but not VP16 and VP16 plus BAPTA (NS) at 2 h. Analysis of variance determined that there was a statistically significant difference among the means of the different treatment groups (P < 0.01) at 3 h. The Tukey's multiple paired analysis determined that there was a statistically significant difference between the means of the DMSO-vehicle and VP16 (*, P < 0.05) and VP16 and VP16 plus BAPTA (**, P = 0.01) at 3 h. (B) Similar analysis as in panel A was done at 1, 2, and 3 h after exposure to VP16 with or without LMB (20 ng/ml). (C) Similar analysis as in panel A was done at 3 h after exposure to VP16 with or without LMB (10 ng/ml) or with or without BAPTA (10 μM). Both agents were given 30 min after VP16 exposure. Analysis of variance determined that there was a statistically significant difference among the means of the different treatment groups (P < 0.01) at 3 h. The Tukey's multiple paired analysis determined that there was a statistically significant difference between the means of the DMSO-vehicle and VP16 (*, P < 0.05) and VP16 and VP16 plus BAPTA (**, P = 0.01) at 3 h. (B) Similar analysis as in panel A was done at 1, 2, and 3 h after exposure to VP16 with or without LMB (20 ng/ml). (C) Similar analysis as in panel A was done at 3 h after exposure to VP16 with or without LMB (10 ng/ml) or with or without BAPTA (10 μM). Both agents were given 30 min after VP16 exposure. Analysis of variance determined that there was a statistically significant difference among the means of the different treatment groups (P < 0.01). The Tukey's multiple paired analysis determined that there was a statistically significant difference between the means of the VP16 plus BAPTA and VP16 (*, P < 0.01) and also VP16 plus LMB (**, P < 0.01). However, VP16 and LMB were NS. (D) 1.3E2 cells stably expressing Myc-NEMO were left untreated or exposed to LMB, fixed, and stained with anti-IκBα, anti-Myc, and DAPI to examine the nuclear accumulation of IκBα with LMB treatment. (E) 1.3E2 cells stably expressing Myc-NEMO were left untreated or treated with LMB (20 ng/ml) for 30 min and then exposed to VP16 (10 μM, 2 h) or lipopolysaccharide (10 μg/ml, 30 min). Total cell extracts were then analyzed by EMSA for NF-κB activation and Western blotting with anti-IκBα and anti-IκBβ. (F) HEK293 cells were transiently transfected with siRNA specific to calreticulin (CRT) or control nonspecific siRNA 24 h prior to exposure to VP16 (10 μM, 2 h). Total cell extracts were then analyzed for NF-κB and Oct-1 activities by EMSA. (G) Serial dilutions of total cell extracts prepared from panel F were analyzed for the levels of calreticulin by Western blotting using anticalreticulin antibody. An antitubulin blot was also performed as a loading control.
FIG. 7.
FIG. 7.
Calcium is required for a nuclear export event downstream of the assembly of the export complex containing Ran-GTP and NEMO. (A) BHK21 and tsBN2 cells were incubated at permissive (33°C) or nonpermissive (39.5°C) temperature for 3 h to cause RCC1 degradation and then exposed to CPT (10 μM, 2 h) at 33°C. Cells in lanes 3, 6, 9, and 12 were first incubated at nonpermissive temperature for 3 h and then returned to the permissive temperature for additional 6 h prior to CPT treatment as above. Total cell extracts were prepared for NF-κB EMSA and Western blotting with anti-RCC1 (α-RCC1) and anti-Ran antibodies. (B) Indicated cells grown at the nonpermissive temperature for 3 h or left in the permissive condition were fixed and stained with anti-p65 antibody. (C) tsBN2 cells were transfected with HA-Ran-WT or HA-Ran-G19V, and these transfected cells were incubated at the nonpermissive temperature for 4 h. Cell extracts were then isolated, and IP assays were performed using anti-HA antibody as described in Materials and Methods. (D) Myc-NEMO was transiently transfected into HEK293 cells, and the cells were left untreated or treated with VP16 for 90 min. BAPTA-AM (30 μM) was also applied 30 min after the addition of VP16. The cell extracts were prepared and the GST pull-down assays were performed using GST-RanBP as described in Materials and Methods. Lanes 1 to 3 show Western blot analysis of indicated proteins after GST pull-down, while lanes 4 to 6 show Western blot analysis of 5% of the input controls. (F) HEK293 cells were treated with BAPTA-AM (20 μM, 120 min). The GST-RanBP pull-down assays were performed as for panel D. (E) HEK293 cells were treated with VP16 (10 μM) for 90 min with BAPTA-AM (30 μM, 30 min). The GST-RanBP pull-down assays were done as described above.

References

    1. Aggarwal, B. B. 2003. Signalling pathways of the TNFα superfamily: a double-edged sword. Nat. Rev. Immunol. 3:745-756. - PubMed
    1. Akira, S., and K. Takeda. 2004. Toll-like receptor signalling. Nat. Rev. Immunol. 4:499-511. - PubMed
    1. Amundson, S. A., M. Bittner, and A. J. Fornace. 2003. Functional genomics as a window on radiation stress signaling. Oncogene 22:5828-5833. - PubMed
    1. Bakkenist, C. J., and M. B. Kastan. 2003. DNA damage activates ATM through intermolecular autophosphorylation and dimer dissociation. Nature 421:499-506. - PubMed
    1. Baldwin, A. S. 2001. Control of oncogenesis and cancer therapy resistance by the transcription factor NF-κB. J. Clin. Investig. 107:241-246. - PMC - PubMed

Publication types

MeSH terms