

Cytoplasmic decay of intergenic transcripts in Saccharomyces cerevisiae
- PMID: 17074811
- PMCID: PMC1800667
- DOI: 10.1128/MCB.01023-06
Cytoplasmic decay of intergenic transcripts in Saccharomyces cerevisiae
Abstract
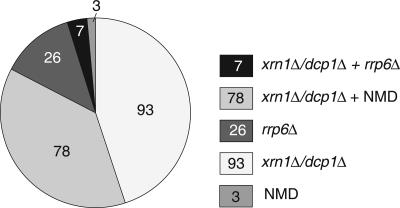
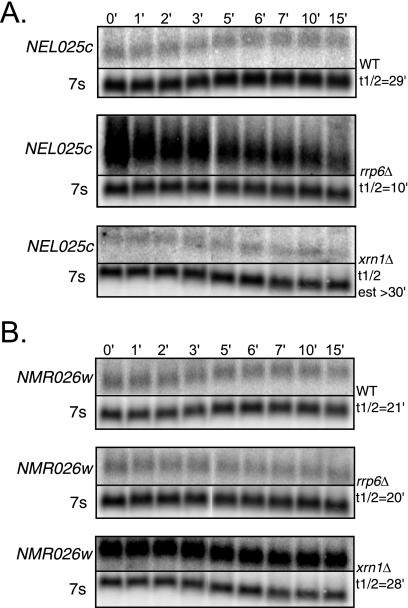
Eukaryotes produce a number of noncoding transcripts from intergenic regions. In Saccharomyces cerevisiae, such cryptic unstable transcripts (CUTs) are thought to be degraded in the nucleus by a process involving polyadenylation and 3'-to-5' degradation by the nuclear exosome. In this work, we examine the degradation pathway of the RNA SRG1, which is produced from an intergenic region and contributes to the regulation of the SER3 gene by promoter occlusion during SRG1 transcription. Although there is some effect on SRG1 transcript levels when the nuclear exosome is compromised, the bulk of the SRG1 RNA is degraded in the cytoplasm by decapping and 5'-to-3' exonucleolytic digestion. Examination of other CUTs suggests that individual CUTs can be degraded by a variety of different mechanisms, including nuclear decay, cytoplasmic decapping and 5'-to-3' decay, and nonsense-mediated decay. Moreover, some CUTs appear to be associated with polyribosomes. These results indicate that some CUTs can be exported from the nucleus and enter translation before being degraded, identifying a potential mechanism for the evolution of new protein-encoding genes.
Figures


Similar articles
-
Regulation of an intergenic transcript controls adjacent gene transcription in Saccharomyces cerevisiae.Genes Dev. 2005 Nov 15;19(22):2695-704. doi: 10.1101/gad.1367605. Genes Dev. 2005. PMID: 16291644 Free PMC article.
-
Intergenic transcription is required to repress the Saccharomyces cerevisiae SER3 gene.Nature. 2004 Jun 3;429(6991):571-4. doi: 10.1038/nature02538. Nature. 2004. PMID: 15175754
-
The Paf1 complex represses SER3 transcription in Saccharomyces cerevisiae by facilitating intergenic transcription-dependent nucleosome occupancy of the SER3 promoter.Eukaryot Cell. 2011 Oct;10(10):1283-94. doi: 10.1128/EC.05141-11. Epub 2011 Aug 26. Eukaryot Cell. 2011. PMID: 21873510 Free PMC article.
-
Making sense of nonsense in yeast.Trends Biochem Sci. 1996 Nov;21(11):433-8. doi: 10.1016/s0968-0004(96)10055-4. Trends Biochem Sci. 1996. PMID: 8987399 Review.
-
Exosome complex and pervasive transcription in eukaryotic genomes.Curr Opin Cell Biol. 2009 Jun;21(3):352-8. doi: 10.1016/j.ceb.2009.04.011. Epub 2009 May 19. Curr Opin Cell Biol. 2009. PMID: 19467852 Review.
Cited by
-
Dxo1 is a new type of eukaryotic enzyme with both decapping and 5'-3' exoribonuclease activity.Nat Struct Mol Biol. 2012 Oct;19(10):1011-7. doi: 10.1038/nsmb.2381. Epub 2012 Sep 9. Nat Struct Mol Biol. 2012. PMID: 22961381 Free PMC article.
-
Tye7 regulates yeast Ty1 retrotransposon sense and antisense transcription in response to adenylic nucleotides stress.Nucleic Acids Res. 2012 Jul;40(12):5271-82. doi: 10.1093/nar/gks166. Epub 2012 Feb 29. Nucleic Acids Res. 2012. PMID: 22379133 Free PMC article.
-
Interdomain dynamics and coactivation of the mRNA decapping enzyme Dcp2 are mediated by a gatekeeper tryptophan.Proc Natl Acad Sci U S A. 2012 Feb 21;109(8):2872-7. doi: 10.1073/pnas.1113620109. Epub 2012 Feb 9. Proc Natl Acad Sci U S A. 2012. PMID: 22323607 Free PMC article.
-
Tri-snRNP-associated proteins interact with subunits of the TRAMP and nuclear exosome complexes, linking RNA decay and pre-mRNA splicing.RNA Biol. 2012 Mar;9(3):334-42. doi: 10.4161/rna.19431. Epub 2012 Mar 1. RNA Biol. 2012. PMID: 22336707 Free PMC article.
-
Nonsense-Mediated Decay Restricts LncRNA Levels in Yeast Unless Blocked by Double-Stranded RNA Structure.Mol Cell. 2016 Feb 4;61(3):379-392. doi: 10.1016/j.molcel.2015.12.020. Epub 2016 Jan 21. Mol Cell. 2016. PMID: 26805575 Free PMC article.
References
-
- Albers, E., V. Laize, A. Blomberg, S. Hohmann, and L. Gustafsson. 2003. Ser3p (Yer081wp) and Ser33p (Yil074cp) are phosphoglycerate dehydrogenases in Saccharomyces cerevisiae. J. Biol. Chem. 278:10264-10272. - PubMed
-
- Baker, K. E., and R. Parker. 2004. Nonsense-mediated mRNA decay: terminating erroneous gene expression. Curr. Opin. Cell Biol. 16:293-299. - PubMed
Publication types
MeSH terms
Substances
Grants and funding
LinkOut - more resources
Full Text Sources
Other Literature Sources
Molecular Biology Databases