. 2006 Nov;128(5):495-507.
doi: 10.1085/jgp.200609646.

Ionic mechanisms of cardiac cell swelling induced by blocking Na+/K+ pump as revealed by experiments and simulation

Affiliations

Ionic mechanisms of cardiac cell swelling induced by blocking Na+/K+ pump as revealed by experiments and simulation

Ayako Takeuchi et al. J Gen Physiol. 2006 Nov.

Abstract

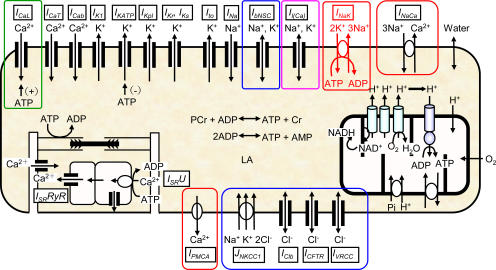
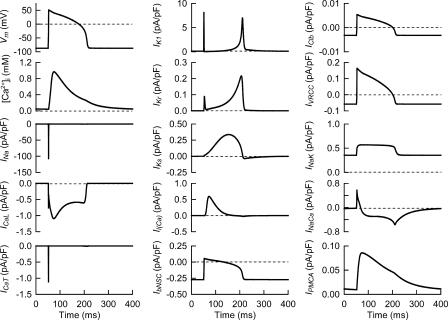
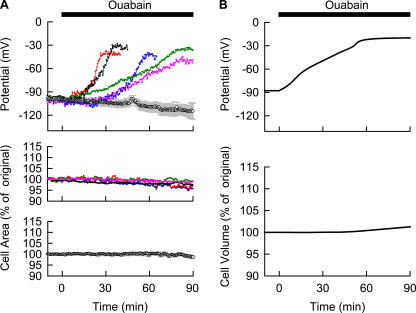
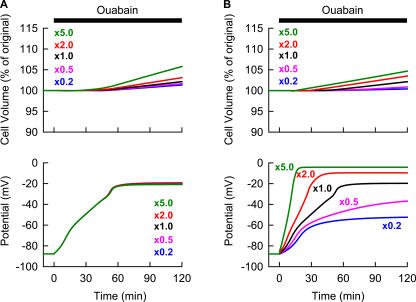
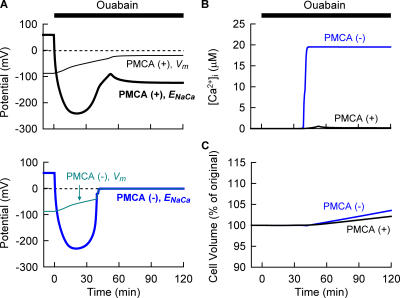
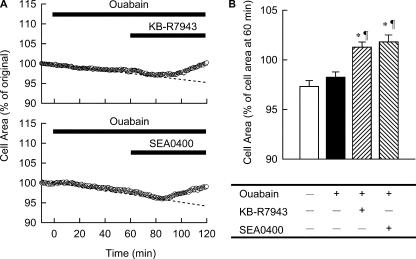
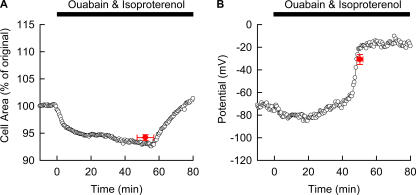
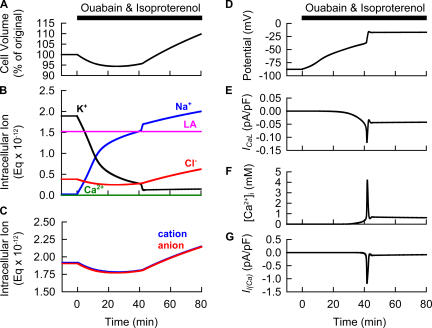
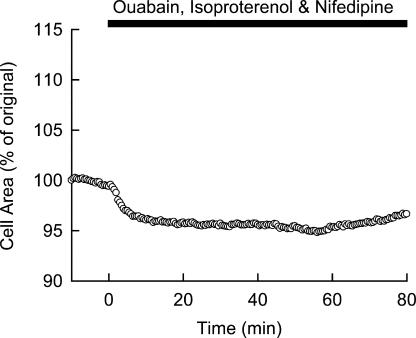
Although the Na(+)/K(+) pump is one of the key mechanisms responsible for maintaining cell volume, we have observed experimentally that cell volume remained almost constant during 90 min exposure of guinea pig ventricular myocytes to ouabain. Simulation of this finding using a comprehensive cardiac cell model (Kyoto model incorporating Cl(-) and water fluxes) predicted roles for the plasma membrane Ca(2+)-ATPase (PMCA) and Na(+)/Ca(2+) exchanger, in addition to low membrane permeabilities for Na(+) and Cl(-), in maintaining cell volume. PMCA might help maintain the [Ca(2+)] gradient across the membrane though compromised, and thereby promote reverse Na(+)/Ca(2+) exchange stimulated by the increased [Na(+)](i) as well as the membrane depolarization. Na(+) extrusion via Na(+)/Ca(2+) exchange delayed cell swelling during Na(+)/K(+) pump block. Supporting these model predictions, we observed ventricular cell swelling after blocking Na(+)/Ca(2+) exchange with KB-R7943 or SEA0400 in the presence of ouabain. When Cl(-) conductance via the cystic fibrosis transmembrane conductance regulator (CFTR) was activated with isoproterenol during the ouabain treatment, cells showed an initial shrinkage to 94.2 +/- 0.5%, followed by a marked swelling 52.0 +/- 4.9 min after drug application. Concomitantly with the onset of swelling, a rapid jump of membrane potential was observed. These experimental observations could be reproduced well by the model simulations. Namely, the Cl(-) efflux via CFTR accompanied by a concomitant cation efflux caused the initial volume decrease. Then, the gradual membrane depolarization induced by the Na(+)/K(+) pump block activated the window current of the L-type Ca(2+) current, which increased [Ca(2+)](i). Finally, the activation of Ca(2+)-dependent cation conductance induced the jump of membrane potential, and the rapid accumulation of intracellular Na(+) accompanied by the Cl(-) influx via CFTR, resulting in the cell swelling. The pivotal role of L-type Ca(2+) channels predicted in the simulation was demonstrated in experiments, where blocking Ca(2+) channels resulted in a much delayed cell swelling.


Figures

Figure 1.
Figure 1.
Schematic diagram of the Kyoto model. The channels and transporters focused on in relation to the volume regulation were boxed off. For abbreviations, see the abbreviations list and Table S1 in the online supplemental material.
Figure 2.
Figure 2.
Action potential, Ca2+ transient and major ionic currents and transporters of the Kyoto model during a steady cycle of 2.5 Hz stimulation. For abbreviations, see Abbreviations list and Table S1 in the online supplemental material. To facilitate comparing relative magnitude of the Ca2+ flux through PMCA (μmol/liter cytosol/s), the Ca2+ flux was expressed in pA/pF, neglecting the antiport with H+.
Figure 3.
Figure 3.
Experimental recordings of the cell area and Vm during the Na+/K+ pump block (A) and simulation of the Na+/K+ pump block using the Kyoto model (B). (A) Top panel shows measurements of Vm in five representative cells (colored lines) with 40 μM ouabain. The control records obtained in the absence of ouabain were averaged and represented as mean ± SEM (n = 4). Measurements of cell area (n = 5) with 40 μM ouabain were shown in the middle panel with different colors. The control records obtained in the absence of ouabain were presented as mean ± SEM in the bottom panel (n = 5). The joining error bars represent contour of the plots. When the error bars are not shown, they are smaller than the symbols. (B) The simulation of the corresponding experimental condition was performed by applying 40 μM ouabain at time 0 to the Kyoto model and the time courses of Vt expressed in percent of original Vt (top) and Vm (bottom) were shown.
Figure 4.
Figure 4.
Sensitivity analyses of varying magnitude of membrane Cl or Na+ conductance, which is involved in the cell volume as well as Vm modulation evoked by the Na+/K+ block. Throughout the recording time, no electrical stimulation was applied. The [Ca2+]o of 20 μM was used (see text for detail). The steady state in model parameters was established before applying ouabain. (A) The relative magnitude of PClb was varied at constant × 1 PbNSC as indicated in the graph at time 0 simultaneously with the start of the Na+/K+ pump block (40 μM ouabain). In parallel to the PClb alteration, MNKCC1 was also scaled to maintain [Cl]i at 30 mM. Changes in Vt and Vm at various PClb were plotted with the corresponding colors of numerals as indicated in the upper graph. (B) At time 0, the PbNSC was varied at constant × 1 PClb as indicated by numerals simultaneously with the Na+/K+ pump block.
Figure 5.
Figure 5.
Simulation of the Na+/K+ pump block with or without PMCA. At time 0, 40 μM ouabain was applied. The amplitude factor of PMCA was reduced to zero at time 0 in the case of simulation without PMCA. Changes in Vm (thin lines) as well as ENaCa (thick lines) were calculated with (top) or without (bottom) PMCA in A. [Ca2+]i in B and Vt in C. Black and blue lines are simulated results with and without PMCA, respectively. Without PMCA, the Vm completely overlapped with the trace of ENaCa after 42 min. The Vt at 120 min was 102.1% and 103.6% with and without PMCA, respectively. Note that the [Ca2+]i (19.50 μM) in the absence of PMCA is nearly equilibrated with the [Ca2+]o 42 min after the onset of ouabain, while [Ca2+]i in the presence of PMCA is 0.18 μM at 120 min.
Figure 6.
Figure 6.
Experimental validation of the role of Na+/Ca2+ exchanger in the cell volume regulation. On the top of 40 μM ouabain, 20 μM KB-R7943 or 1 μM SEA0400 was applied at 60 min. (A) A representative time course of cell area with the use of KB-R7943 (top) or SEA0400 (bottom). A dotted line was fitted by eye over the initial half of the experimental time. (B) The cell area at 120 min was expressed as percent of that at 60 min. Each column represents mean ± SEM (n = 5–13). *, P < 0.01, significantly different from cells treated with normal Tyrode solution for 120 min (open bar). ¶, P < 0.01, significantly different from cells treated with ouabain for 120 min (filled bar).
Figure 7.
Figure 7.
Experimental recordings of the cell area and Vm during the Na+/K+ pump block with increased membrane Cl conductance. The ventricular cells were incubated with 40 μM ouabain as well as 1 μM isoproterenol, and the cell area (A) and Vm (B) were measured in different cells (n = 5–8). Mean ± SEM of time and cell area measured just before a start of obvious cell swelling were superimposed on the representative recording (A). Mean ± SEM of time just after the Vm jump and that of peak Vm were superimposed on the representative recording (B).
Figure 8.
Figure 8.
Model prediction for the experimental observations in Fig. 7. At time 0, 40 μM ouabain and 1 μM isoproterenol were applied simultaneously. Changes in Vt (A), amounts of intracellular ions expressed as Eq × 10−12 (B), amounts of intracellular cation (blue) or anion (red) (C), Vm (D), ICaL (E), [Ca2+]i (F), and Il (Ca) (G) were demonstrated. Since the present simulation ignores minor changes in anion concentrations accompanying the Ca2+ binding to proteins and Ca2+ flux into SR, there is a slight difference between total amounts of cation and anion.
Figure 9.
Figure 9.
Experimental validation of the ICaL involvement in the cell swelling as predicted in Fig. 8. 5 μM nifedipine was applied to block ICaL simultaneously with 40 μM ouabain and 1 μM isoproterenol. A representative record is shown.

Comment in

References

    1. Akar, J.G., T.H. Everett, R. Ho, J.C. Craft, D.E. Haines, A.P. Somlyo, and A.V. Somlyo. 2003. Intracellular chloride accumulation and subcellular elemental distribution during atrial fibrillation. Circulation. 107:1810–1815. - PubMed
    1. Armstrong, C.M. 2003. The Na/K pump, Cl ion, and osmotic stabilization of cells. Proc. Natl. Acad. Sci. USA. 100:6257–6262. - PMC - PubMed
    1. Bahinski, A., A.C. Nairn, P. Greengard, and D.C. Gadsby. 1989. Chloride conductance regulated by cyclic AMP-dependent protein kinase in cardiac myocytes. Nature. 340:718–721. - PubMed
    1. Bak, M.I., and J.S. Ingwall. 2003. Contribution of Na+/H+ exchange to Na+ overload in the ischemic hypertrophied hyperthyroid rat heart. Cardiovasc. Res. 57:1004–1014. - PubMed
    1. Baker, P.F., M.P. Blaustein, R.D. Keynes, J. Manil, T.I. Shaw, and R.A. Steinhardt. 1969. The ouabain-sensitive fluxes of sodium and potassium in squid giant axons. J. Physiol. 200:459–496. - PMC - PubMed

Publication types

MeSH terms