Comparative Study
. 2006 Nov;15(11):2507-24.
doi: 10.1110/ps.062416606.

Statistical potential for assessment and prediction of protein structures

Affiliations
Comparative Study

Statistical potential for assessment and prediction of protein structures

Min-Yi Shen et al. Protein Sci. 2006 Nov.

Abstract

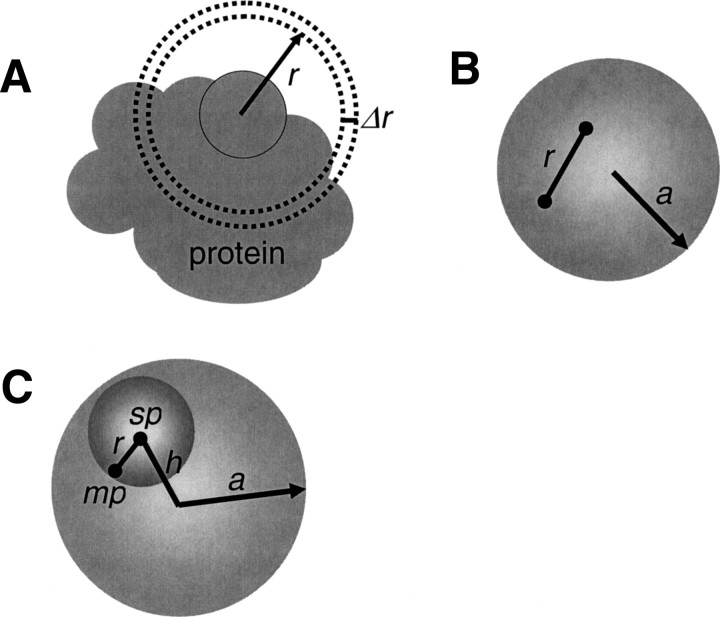
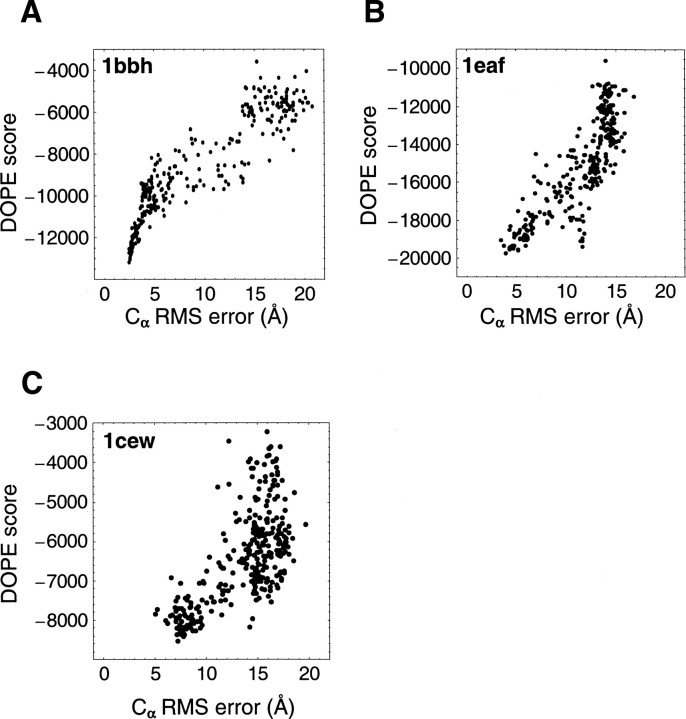
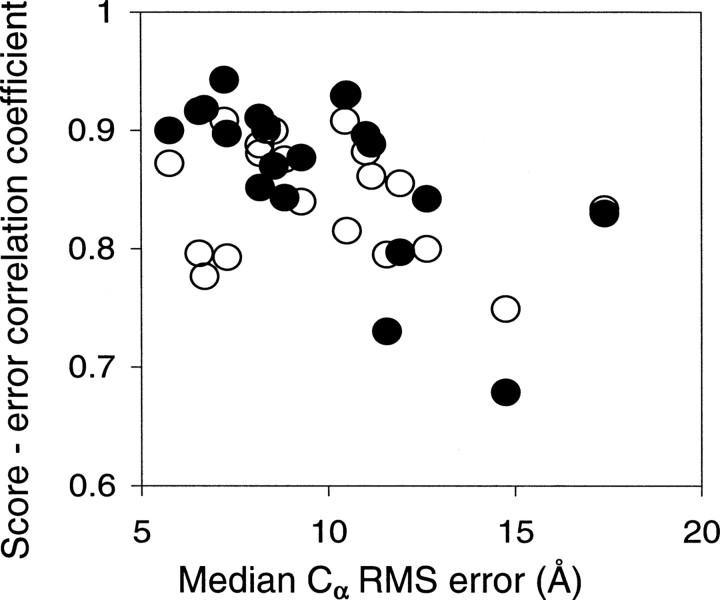
Protein structures in the Protein Data Bank provide a wealth of data about the interactions that determine the native states of proteins. Using the probability theory, we derive an atomic distance-dependent statistical potential from a sample of native structures that does not depend on any adjustable parameters (Discrete Optimized Protein Energy, or DOPE). DOPE is based on an improved reference state that corresponds to noninteracting atoms in a homogeneous sphere with the radius dependent on a sample native structure; it thus accounts for the finite and spherical shape of the native structures. The DOPE potential was extracted from a nonredundant set of 1472 crystallographic structures. We tested DOPE and five other scoring functions by the detection of the native state among six multiple target decoy sets, the correlation between the score and model error, and the identification of the most accurate non-native structure in the decoy set. For all decoy sets, DOPE is the best performing function in terms of all criteria, except for a tie in one criterion for one decoy set. To facilitate its use in various applications, such as model assessment, loop modeling, and fitting into cryo-electron microscopy mass density maps combined with comparative protein structure modeling, DOPE was incorporated into the modeling package MODELLER-8.


Figures

Figure 1.
Figure 1.
Schematic representation of the reference state. (A) An illustration showing why only a fraction of a spherical shell generally contributes to the normalization function (Equation 3). (B) A pair of noninteracting atoms in a protein is modeled by two points positioned randomly inside a sphere with radius a; the points are at distance r from each other. The normalization function n(r) in Equation 7 corresponds to repeating this random assignment for an infinite number of times. (C) The definition of terms used to write Equations 8–11. The large and small spheres are the reference and probe spheres, respectively.
Figure 2.
Figure 2.
Comparison of the analytical normalization function (line; Equation 7) with the numerical simulation (points). The simulated sample includes one- million pairs of points located randomly inside a sphere with the radius a of 22 Å (Fig. ▶); the bin size is 1 Å.
Figure 3.
Figure 3.
The effective exponent α of a sphere as a function of interparticle distance r (Equation 8). The dashed, thin, and thick curves show the effective exponents α(r) for sphere radii a of 20, 22, and 24 Å, respectively. The horizontal dashed line marks the effective exponent used by DFIRE (α = 1.61).
Figure 4.
Figure 4.
Distance dependence of DOPE, DFIRE, and RAPDF. (A) Cys N atom–Trp O atom. (B) Ile Cα atom–Leu Cδ atom. (C) Ile Cβ atom–Leu Cβ atom. (D) Asp Cβ atom–Leu Cβ atom. The DFIRE and RAPDF plots are reproduced from Zhou and Zhou (2002). All statistical potentials are shown with linear interpolation between their estimated values at discrete distances (cf. when using DOPE, interpolation by cubic splines is applied, as described in Materials and Methods, resulting in smoother curves than shown here).
Figure 5.
Figure 5.
Score–error correlation (see Materials and Methods) for DOPE, using three targets from the moulder decoy set. (A) High correlation, correlation coefficient r = 0.92 (1bbh). (B) Medium correlation, r = 0.84 (1eaf). (C) Relatively low correlation, r = 0.68 (1cew).
Figure 6.
Figure 6.
Sample structure assessment that benefits from using the correct reference sphere size. The best-scored model of the target 1bbh in the moulder decoy set with (A) DOPE based on an underestimated radius of the reference sphere a of 16 Å. The Cα RMS error of this model is 15.4 Å. (B) When DOPE is calculated with the size a of 23 Å, it correctly scores the native structure better than any of the 300 decoys.
Figure 7.
Figure 7.
Score–error correlation coefficient as a function of the median model accuracy for the 20 targets in the moulder decoy set. (Filled circles) DOPE, correlation coefficient of −0.62; (open circles) Rosetta, correlation coefficient of −0.27.

References

    1. Alder, B. 1964. Triplet correlations in hard spheres. Phys. Rev. Lett. 12 317–319.
    1. Anfinsen, C.B. 1972. The formation and stabilization of protein structure. Biochem. J. 128 737–749. - PMC - PubMed
    1. Anfinsen, C.B. 1973. Principles that govern the folding of protein chains. Science 181 223–230. - PubMed
    1. Bastolla, U., Vendruscolo, M., and Knapp, E.W. 2000. A statistical mechanical method to optimize energy functions for protein folding. Proc. Natl. Acad. Sci. 97 3977–3981. - PMC - PubMed
    1. Bauer, A. and Beyer, A. 1994. An improved pair potential to recognize native protein folds. Proteins 18 254–261. - PubMed

Publication types

LinkOut - more resources