. 2006 Oct;3(10):e422.
doi: 10.1371/journal.pmed.0030422.

Analysis of gene expression using gene sets discriminates cancer patients with and without late radiation toxicity

Affiliations

Analysis of gene expression using gene sets discriminates cancer patients with and without late radiation toxicity

J Peter Svensson et al. PLoS Med. 2006 Oct.

Abstract

Background: Radiation is an effective anti-cancer therapy but leads to severe late radiation toxicity in 5%-10% of patients. Assuming that genetic susceptibility impacts this risk, we hypothesized that the cellular response of normal tissue to X-rays could discriminate patients with and without late radiation toxicity.

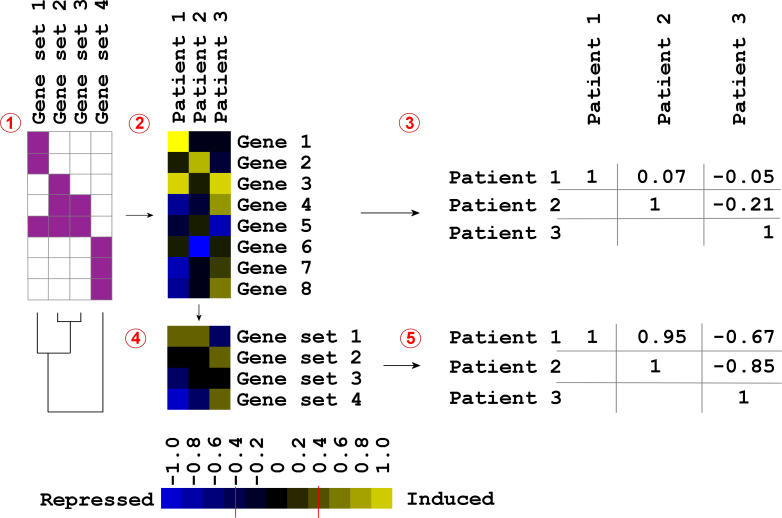
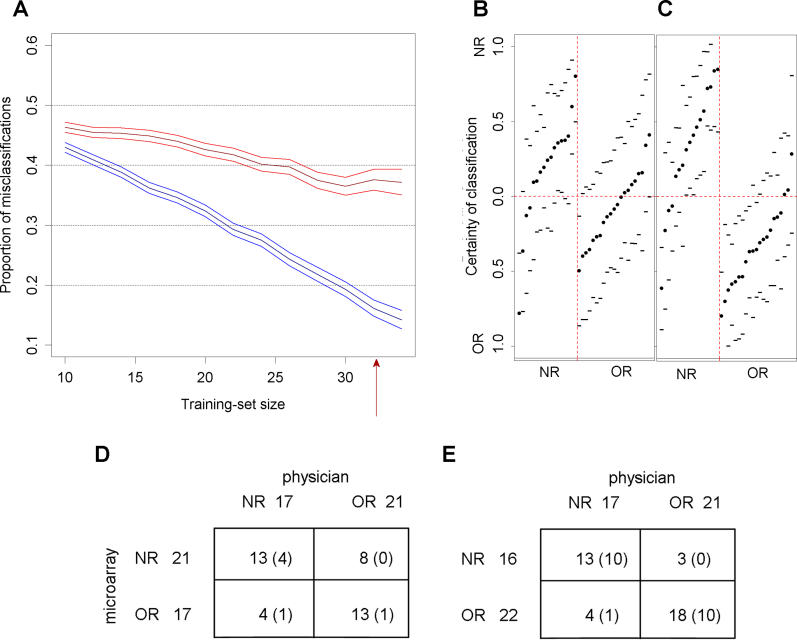
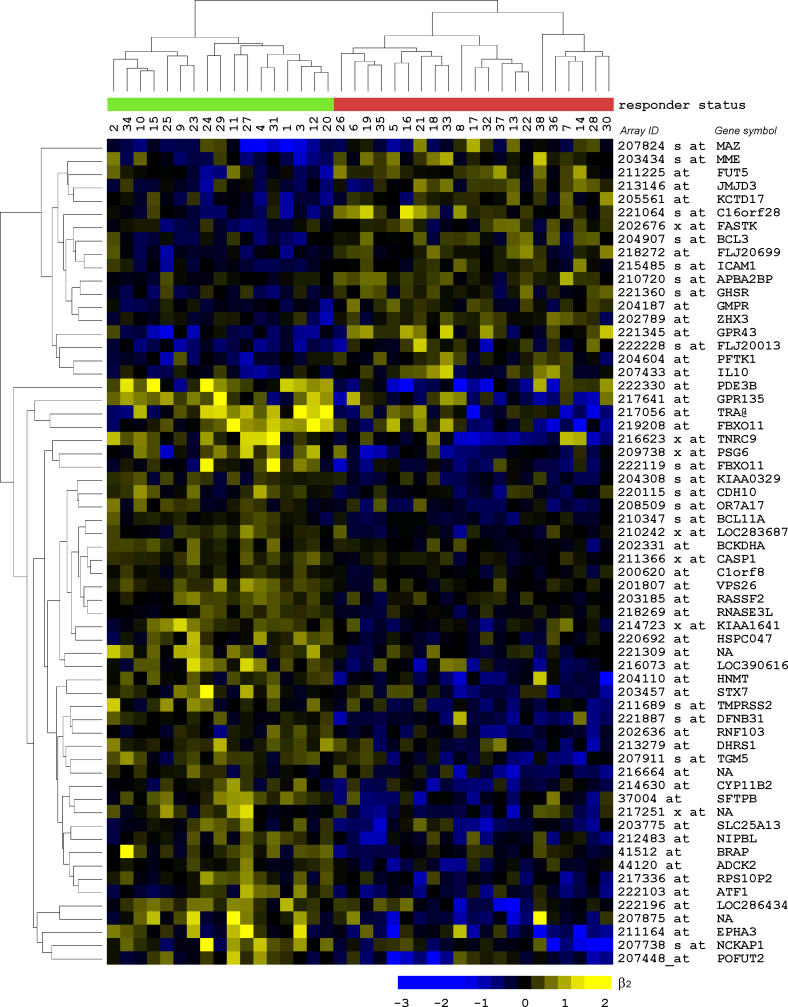
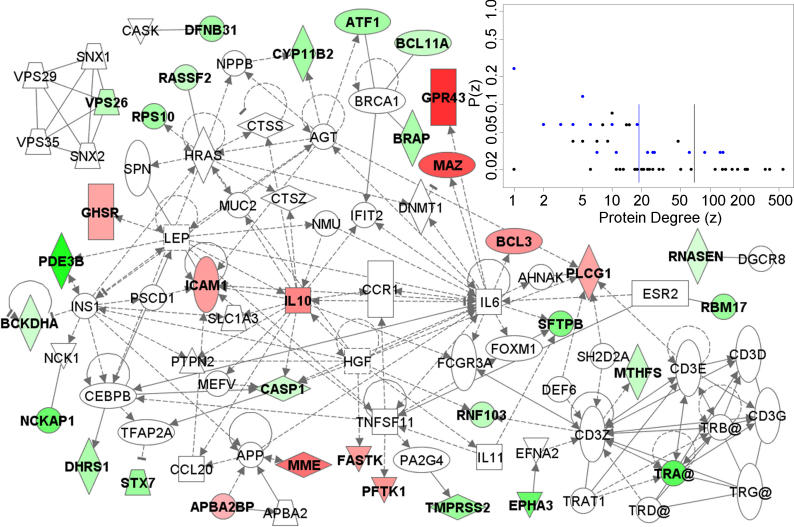
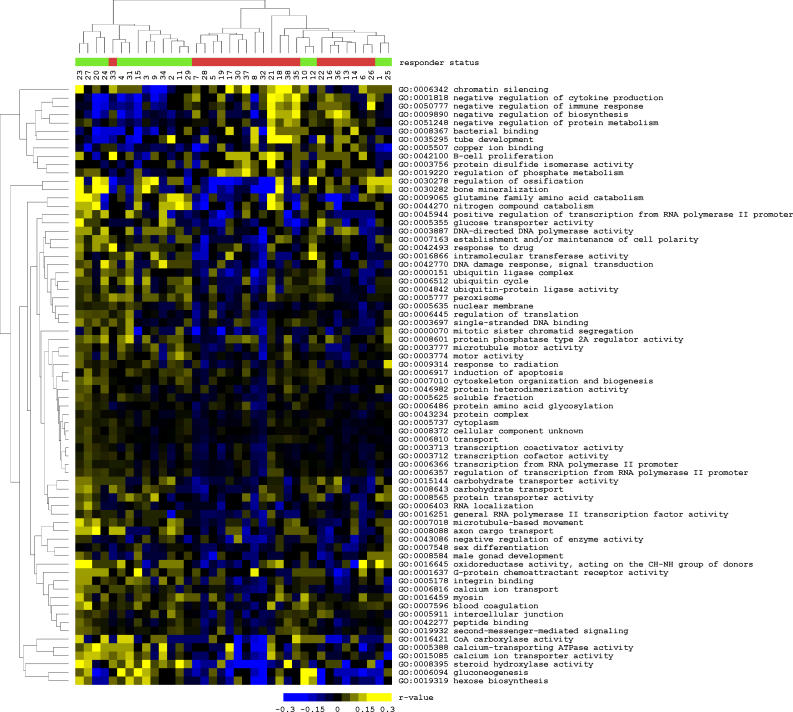
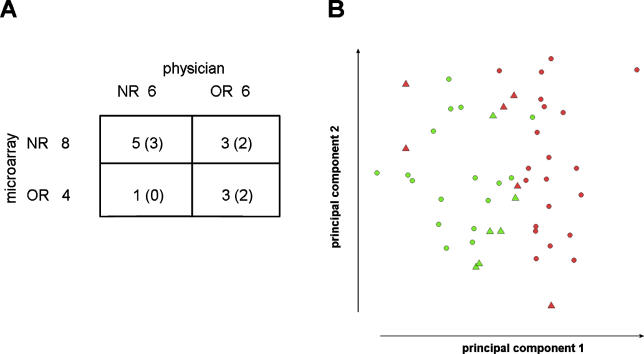
Methods and findings: Prostate carcinoma patients without evidence of cancer 2 y after curative radiotherapy were recruited in the study. Blood samples of 21 patients with severe late complications from radiation and 17 patients without symptoms were collected. Stimulated peripheral lymphocytes were mock-irradiated or irradiated with 2-Gy X-rays. The 24-h radiation response was analyzed by gene expression profiling and used for classification. Classification was performed either on the expression of separate genes or, to augment the classification power, on gene sets consisting of genes grouped together based on function or cellular colocalization.X-ray irradiation altered the expression of radio-responsive genes in both groups. This response was variable across individuals, and the expression of the most significant radio-responsive genes was unlinked to radiation toxicity. The classifier based on the radiation response of separate genes correctly classified 63% of the patients. The classifier based on affected gene sets improved correct classification to 86%, although on the individual level only 21/38 (55%) patients were classified with high certainty. The majority of the discriminative genes and gene sets belonged to the ubiquitin, apoptosis, and stress signaling networks. The apoptotic response appeared more pronounced in patients that did not develop toxicity. In an independent set of 12 patients, the toxicity status of eight was predicted correctly by the gene set classifier.

Conclusions: Gene expression profiling succeeded to some extent in discriminating groups of patients with and without severe late radiotherapy toxicity. Moreover, the discriminative power was enhanced by assessment of functionally or structurally related gene sets. While prediction of individual response requires improvement, this study is a step forward in predicting susceptibility to late radiation toxicity.


Conflict of interest statement

Competing Interests: The authors have declared that no competing interests exist.

Figures

Figure 1
Figure 1. The Principle of Gene Set Classification
Example of gene set analysis consisting of four gene sets, three patients, and eight genes. (1) Definition of the gene sets consisting of 2–3 genes (purple squares). Gene sets 1–3 are partially overlapping. The dendrogram shows the relationship between the gene sets identified using kappa statistics. (2) Heat map of the gene expression response per patient. (3) Pairwise correlations of all gene responses between the patients. Assuming that patient 1 and patient 3 represent different classes, patient 2 would correlate slightly better with patient 1 than with patient 3. (4) For each patient, the gene responses were combined for every gene set and visualized in a heat map. (5) Pairwise correlations of all gene sets between the patients, showing improvement in correct classification of patient 2.
Figure 2
Figure 2. Improved Patient Classification Using Functionally Related Gene Sets
(A) Gene classification (in red) and gene set classification (in blue), following the strategy of Michiels et al. [25], with 95% confidence intervals for the test of proportions. The minimal misclassification rate was 37% ± 2% with gene classification and 14% ± 2% with gene set classification. (B and C) The certainty of microarray classification for each patient was calculated based on (B) genes or (C) functionally related gene sets. The certainty was calculated at the training set size of 32 patients (red arrow in [A]). (D and E) Contingency tables summarizing the concordance between the physician and microarray classifications using (D) genes and (E) gene sets. Numbers of patients classified with certainty (cases where the tolerance limit does not include zero) are in parentheses.
Figure 3
Figure 3. Expression Profiles of Classifying Genes
Heat map of β2 values of 62 genes that were present in more than 20% of the 500 repeated assessments with 34 patients in the training set of the classifier. These discriminating genes were used in a supervised two-dimensional hierarchical clustering of NRs (green) and ORs (red) based on the β2 values representing the radiation response.
Figure 4
Figure 4. The Interactions of Proteins Representing the Gene Classifier
Of the gene products most frequently present in the gene classifier, 33 proteins are present in the Ingenuity database. These are represented by colored symbols (green symbols indicate proteins that have higher induction after irradiation in NRs, and red symbols indicate proteins that have higher induction in ORs). The intensity of the colors indicates the difference between the groups in the magnitude of induction. The connecting proteins are represented by empty symbols. Only three of the colored proteins are not directly or indirectly linked through a connecting protein. Inset: The degree distribution of the proteins in the sub-network. For each protein we calculated the number of interactions in the total human interaction network (protein degree, z) and plotted it against the proportion of each protein degree, P(z). Vertical blue and black lines indicate the average protein degree, showing that the classifier proteins (blue) and the connecting proteins (black) represent two separate populations (p < 0.001, Wilcoxon test).
Figure 5
Figure 5. Expression Profiles of Classifying Gene Sets
Heat map of r values of 72 gene sets that were present in more than 20% of the 500 repeated assessments with 34 patients in the training set of the classifier. These discriminating gene sets were used in a supervised two-dimensional hierarchical clustering of NRs (green) and ORs (red) based on the r values The threshold for being affected was set at |β2| = 0.4.
Figure 6
Figure 6. Validation of the Gene Set Classification with an Independent Patient Set
(A) Contingency table of the physician and microarray classification of 12 additional patients. The 72 most discriminating gene sets in the training set were used to predict responder status. Numbers of patients classified with certainty are in parentheses. (B) A principal components analysis plot of the two principal components separating the NRs (green) from the ORs (red). Circles represent the 38 patients of the original training set, and triangles represent the 12 patients of the independent validation set.

Comment in

References

    1. Turesson I, Carlsson J, Brahme A, Glimelius B, Zackrisson B, et al. Biological response to radiation therapy. Acta Oncol. 2003;42:92–106. - PubMed
    1. Zelefsky MJ, Fuks Z, Hunt M, Lee HJ, Lombardi D, et al. High dose radiation delivered by intensity modulated conformal radiotherapy improves the outcome of localized prostate cancer. J Urol. 2001;166:876–881. - PubMed
    1. Hanks GE, Hanlon AL, Epstein B, Horwitz EM. Dose response in prostate cancer with 8–12 years' follow-up. Int J Radiat Oncol Biol Phys. 2002;54:427–435. - PubMed
    1. Pollack A, Zagars GK, Starkschall G, Antolak JA, Lee JJ, et al. Prostate cancer radiation dose response: Results of the M. D. Anderson phase III randomized trial. Int J Radiat Oncol Biol Phys. 2002;53:1097–1105. - PubMed
    1. Peeters STK, Heemsbergen WD, Van Putten WLJ, Slot A, Tabak H, et al. Acute and late complications after radiotherapy for prostate cancer: Results of a multicenter randomized trial comparing 68 Gy to 78 Gy. Int J Radiat Oncol Biol Phys. 2005;61:1019–1034. - PubMed

Publication types

MeSH terms

Substances