

Mapping the economic costs and benefits of conservation
- PMID: 17076583
- PMCID: PMC1629040
- DOI: 10.1371/journal.pbio.0040360
Mapping the economic costs and benefits of conservation
Abstract
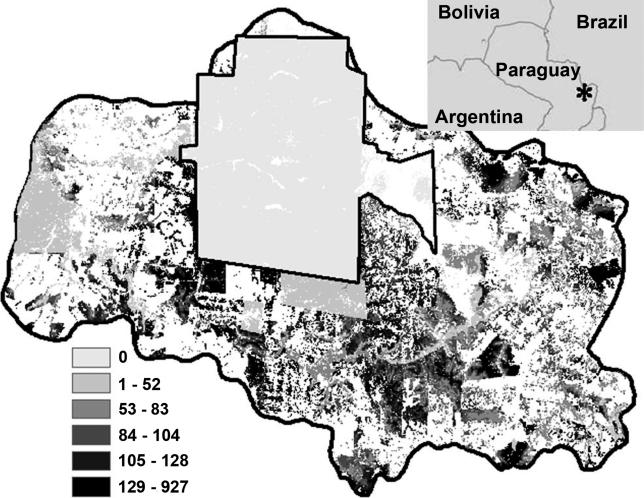
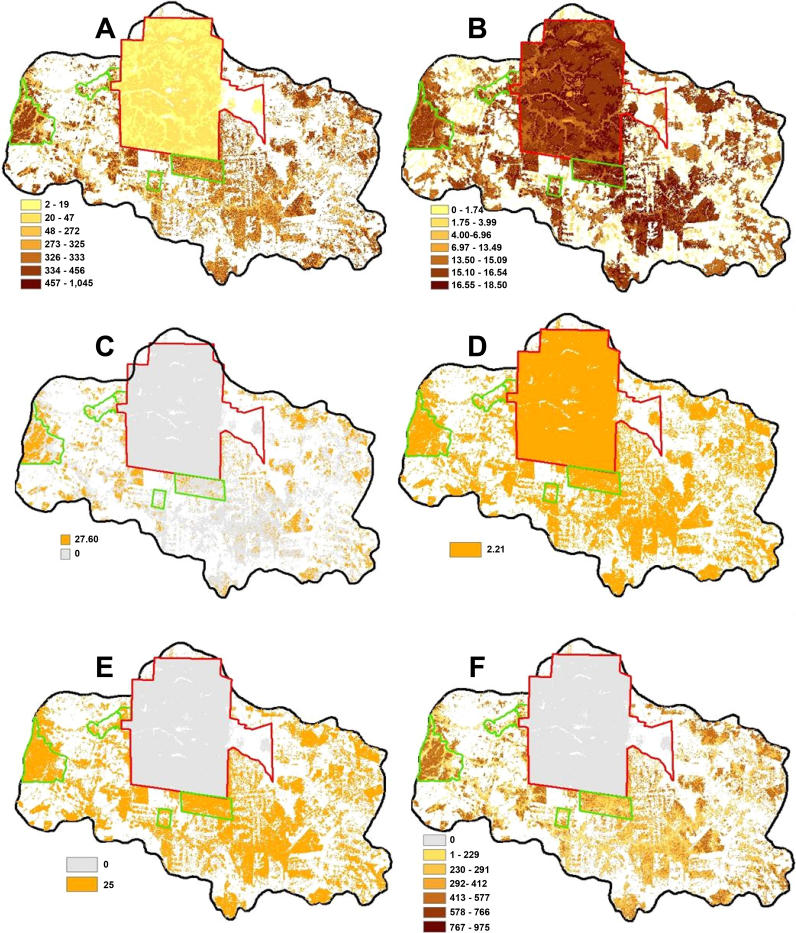
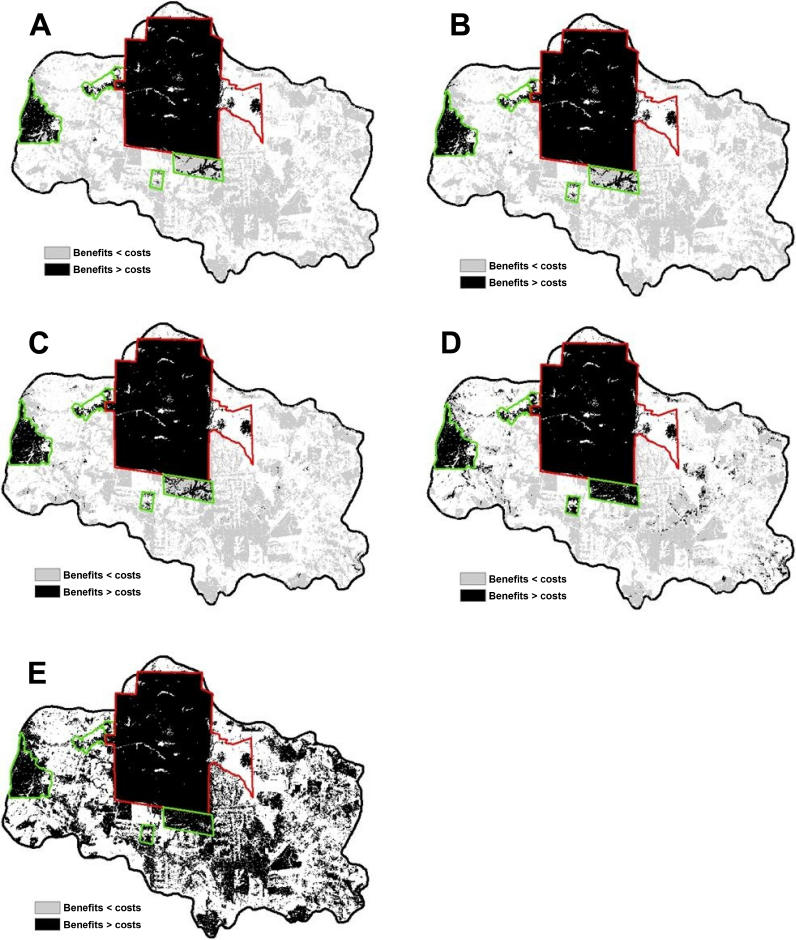
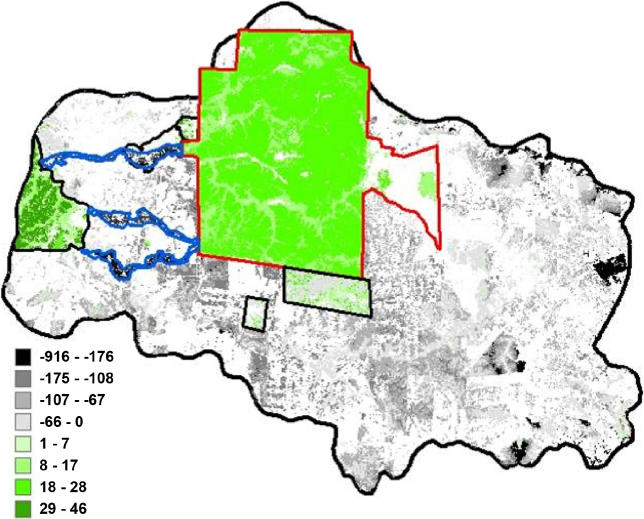
Resources for biodiversity conservation are severely limited, requiring strategic investment. Understanding both the economic benefits and costs of conserving ecosystems will help to allocate scarce dollars most efficiently. However, although cost-benefit analyses are common in many areas of policy, they are not typically used in conservation planning. We conducted a spatial evaluation of the costs and benefits of conservation for a landscape in the Atlantic forests of Paraguay. We considered five ecosystem services (i.e., sustainable bushmeat harvest, sustainable timber harvest, bioprospecting for pharmaceutical products, existence value, and carbon storage in aboveground biomass) and compared them to estimates of the opportunity costs of conservation. We found a high degree of spatial variability in both costs and benefits over this relatively small (approximately 3,000 km(2)) landscape. Benefits exceeded costs in some areas, with carbon storage dominating the ecosystem service values and swamping opportunity costs. Other benefits associated with conservation were more modest and exceeded costs only in protected areas and indigenous reserves. We used this cost-benefit information to show that one potential corridor between two large forest patches had net benefits that were three times greater than two otherwise similar alternatives. Spatial cost-benefit analysis can powerfully inform conservation planning, even though the availability of relevant data may be limited, as was the case in our study area. It can help us understand the synergies between biodiversity conservation and economic development when the two are indeed aligned and to clearly understand the trade-offs when they are not.
Conflict of interest statement
Competing interests. The authors have declared that no competing interests exist.
Figures
Comment in
-
Assessing ecosystem services to identify conservation priorities.PLoS Biol. 2006 Nov;4(11):e392. doi: 10.1371/journal.pbio.0040392. Epub 2006 Oct 31. PLoS Biol. 2006. PMID: 20076490 Free PMC article. No abstract available.
References
-
- Margules CR, Pressey RL. Systematic conservation planning. Nature. 2000;405:243–253. - PubMed
-
- Meir E, Andelman S, Possingham HP. Does conservation planning matter in a dynamic and uncertain world. Ecol Lett. 2004;7:615–622.
-
- Cabeza M, Moilanen A. Site-selection algorithms and habitat loss. Conserv Biol. 2003;17:1402–1413.
-
- Possingham HP, Wilson KA. Turning up the heat on hotspots. Nature. 2005;436:919–920. - PubMed
-
- Daily GC. Nature's services: Societal dependence on natural ecosystems. Washington (DC): Island Press; 1997. 392
Publication types
MeSH terms
LinkOut - more resources
Full Text Sources
Other Literature Sources
