. 2006 Oct;4(11):e365.
doi: 10.1371/journal.pbio.0040365.

Human immunodeficiency virus impairs reverse cholesterol transport from macrophages

Affiliations

Human immunodeficiency virus impairs reverse cholesterol transport from macrophages

Zahedi Mujawar et al. PLoS Biol. 2006 Oct.

Abstract

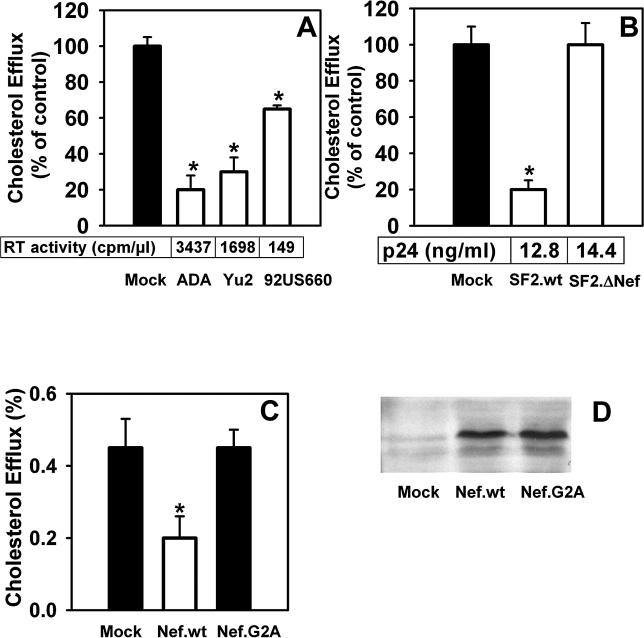
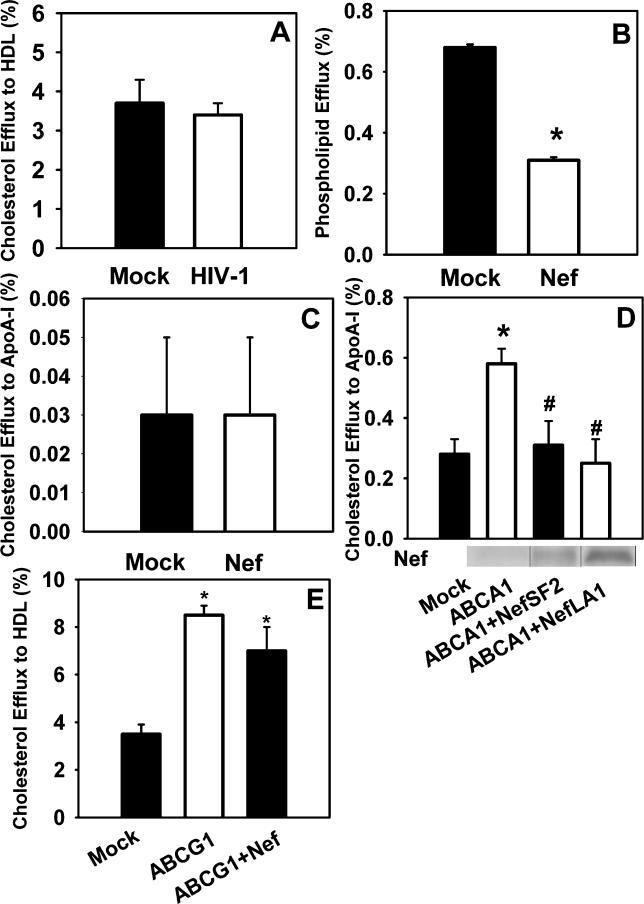
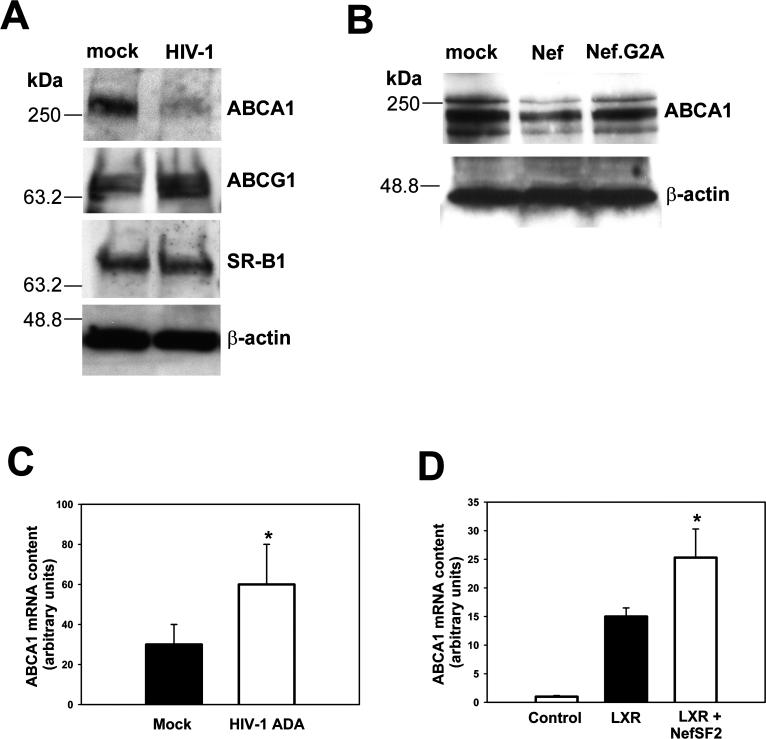
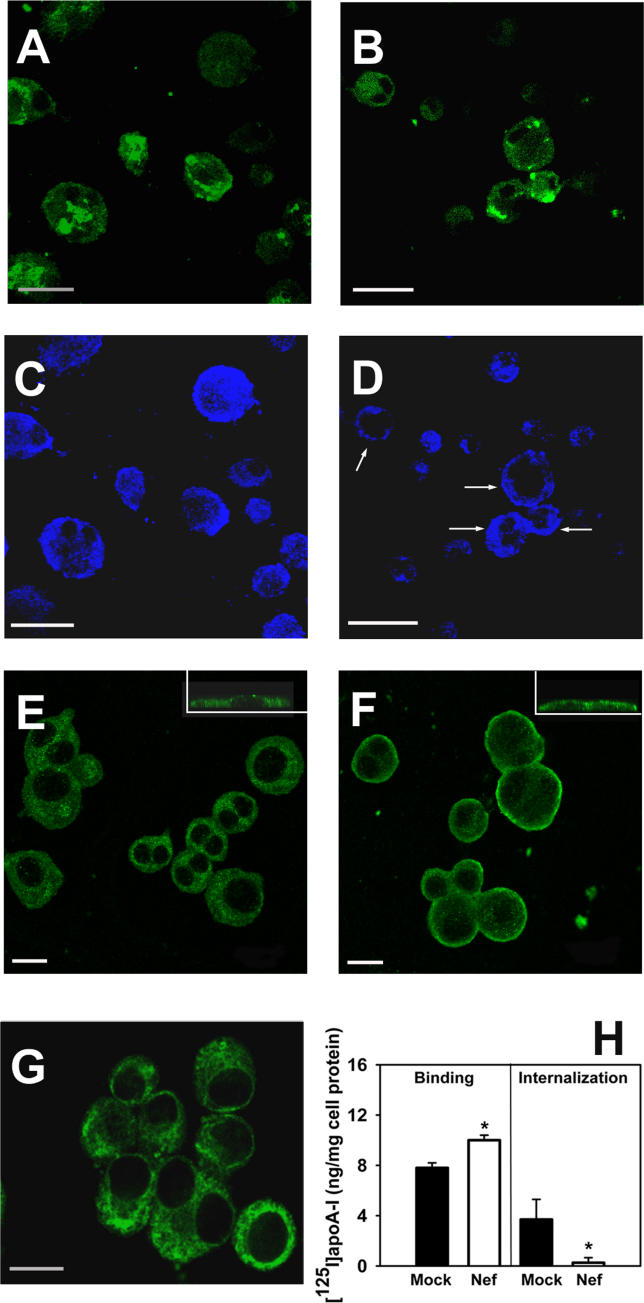
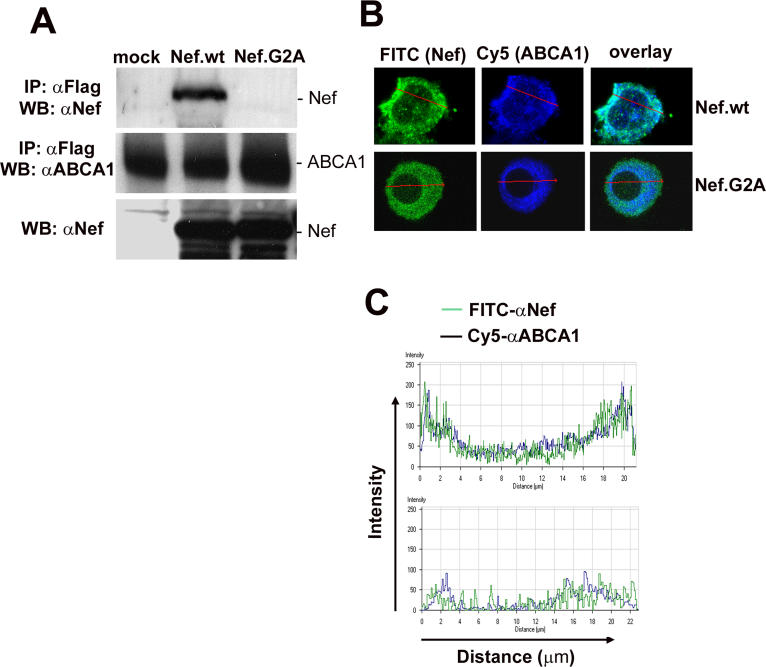
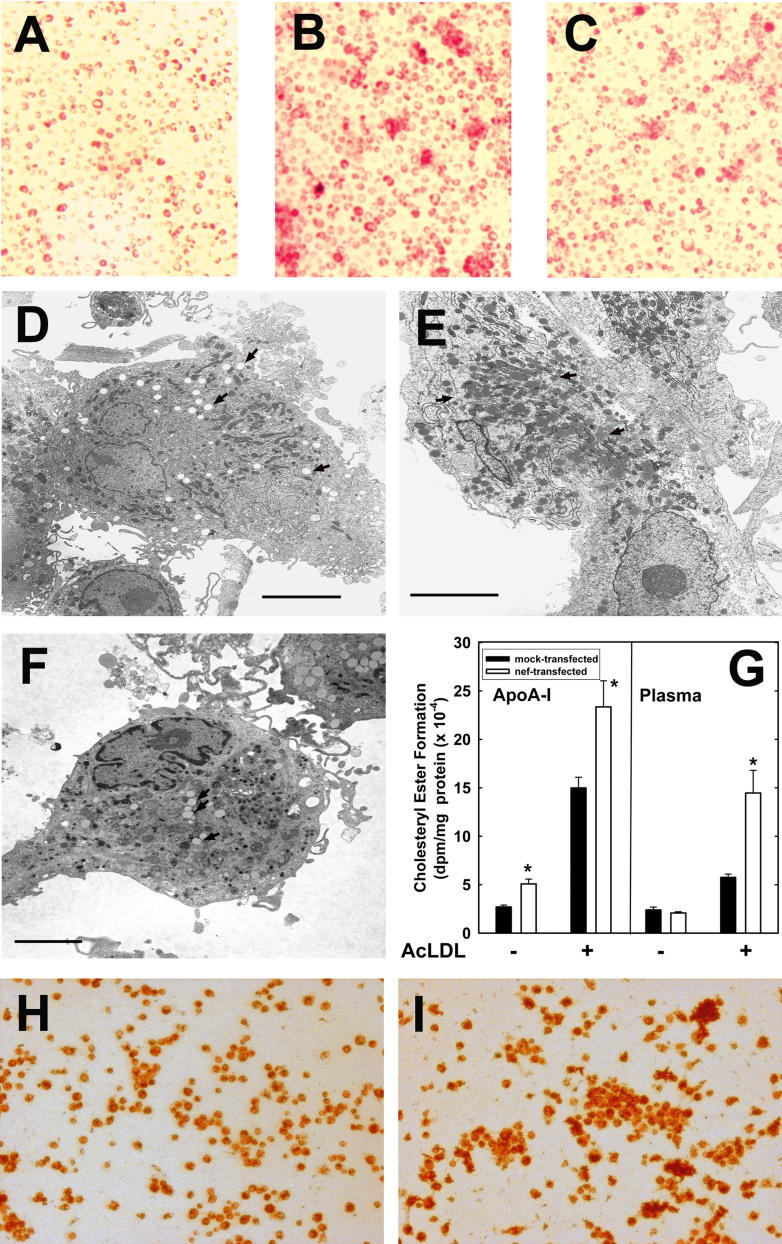
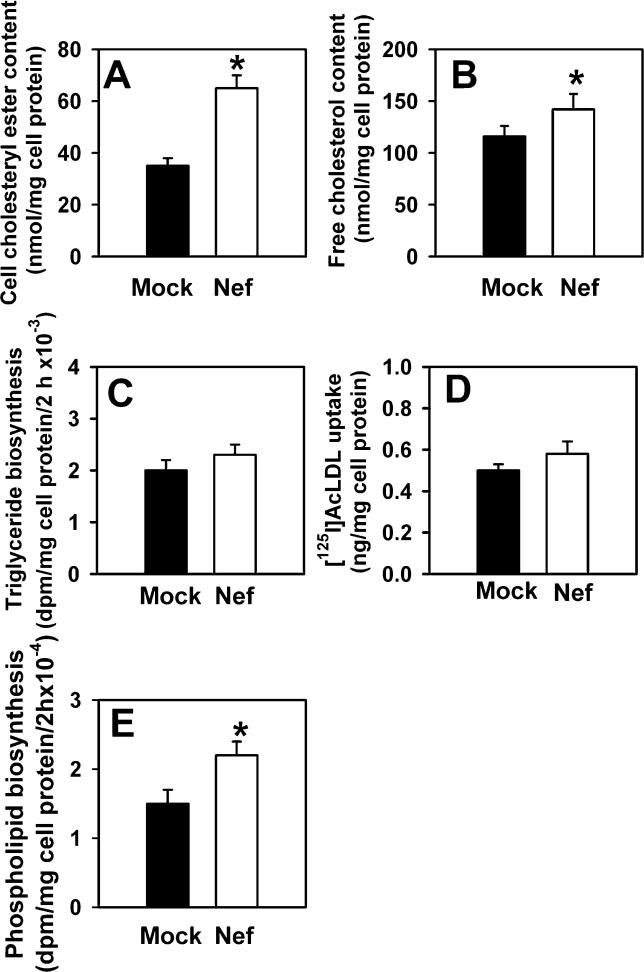
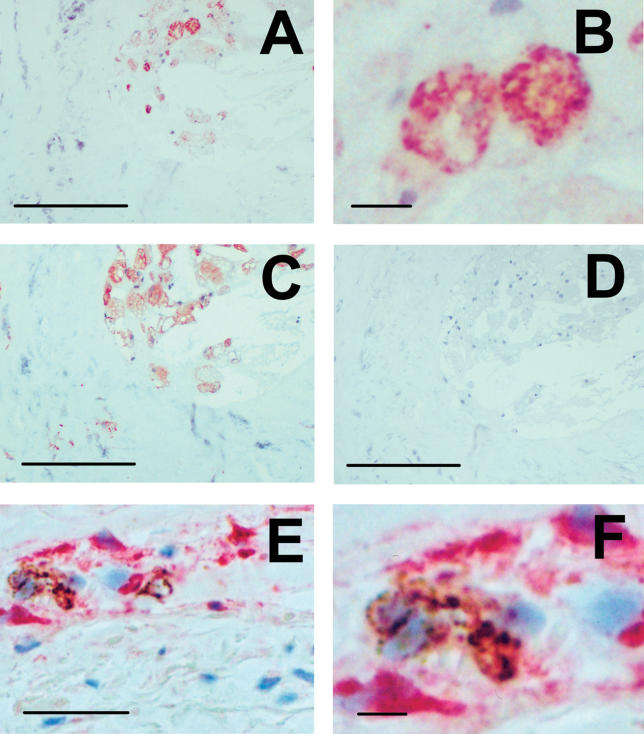
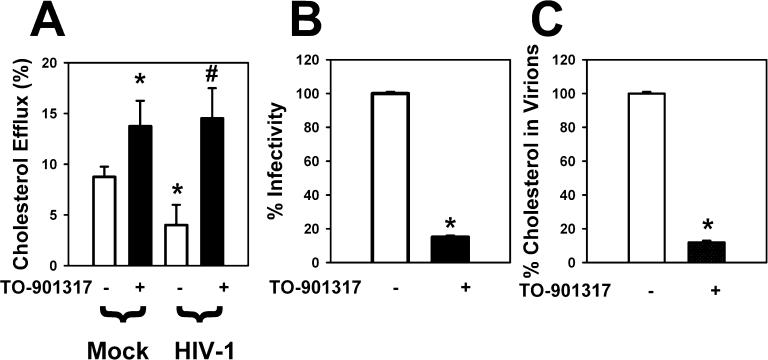
Several steps of HIV-1 replication critically depend on cholesterol. HIV infection is associated with profound changes in lipid and lipoprotein metabolism and an increased risk of coronary artery disease. Whereas numerous studies have investigated the role of anti-HIV drugs in lipodystrophy and dyslipidemia, the effects of HIV infection on cellular cholesterol metabolism remain uncharacterized. Here, we demonstrate that HIV-1 impairs ATP-binding cassette transporter A1 (ABCA1)-dependent cholesterol efflux from human macrophages, a condition previously shown to be highly atherogenic. In HIV-1-infected cells, this effect was mediated by Nef. Transfection of murine macrophages with Nef impaired cholesterol efflux from these cells. At least two mechanisms were found to be responsible for this phenomenon: first, HIV infection and transfection with Nef induced post-transcriptional down-regulation of ABCA1; and second, Nef caused redistribution of ABCA1 to the plasma membrane and inhibited internalization of apolipoprotein A-I. Binding of Nef to ABCA1 was required for down-regulation and redistribution of ABCA1. HIV-infected and Nef-transfected macrophages accumulated substantial amounts of lipids, thus resembling foam cells. The contribution of HIV-infected macrophages to the pathogenesis of atherosclerosis was supported by the presence of HIV-positive foam cells in atherosclerotic plaques of HIV-infected patients. Stimulation of cholesterol efflux from macrophages significantly reduced infectivity of the virions produced by these cells, and this effect correlated with a decreased amount of virion-associated cholesterol, suggesting that impairment of cholesterol efflux is essential to ensure proper cholesterol content in nascent HIV particles. These results reveal a previously unrecognized dysregulation of intracellular lipid metabolism in HIV-infected macrophages and identify Nef and ABCA1 as the key players responsible for this effect. Our findings have implications for pathogenesis of both HIV disease and atherosclerosis, because they reveal the role of cholesterol efflux impairment in HIV infectivity and suggest a possible mechanism by which HIV infection of macrophages may contribute to increased risk of atherosclerosis in HIV-infected patients.


Conflict of interest statement

Competing interests. The authors have declared that no competing interests exist.

Figures

Figure 1
Figure 1. HIV-1 Nef Impairs Cholesterol Efflux from Macrophages
(A) Monocyte-derived macrophages were inoculated with indicated HIV-1 strains equalized according to RT activity and cultivated for 21 d (RT activity in the culture supernatants on day 21 is shown beneath the bars). Mock-infected cells were incubated with virus-free medium. Specific cholesterol efflux to apoA-I (30 μg/ml) was performed for 12 h and analyzed as described in Materials and Methods. Results are presented as percentage of efflux from mock-infected cells (taken as 100%) and are mean ± standard deviation (SD) of triplicate determinations. An asterisk (*) indicates p < 0.001 (B) Monocyte-derived macrophages were inoculated with VSV-G-pseudotyped HIV-1 SF2 either deficient in Nef (SF2.ΔNef) or carrying WT Nef (SF2.wt). Specific cholesterol efflux to apoA-I (30 μg/ml) was analyzed on day 6 after inoculation using the same procedure as described in (A). p24 concentration in the culture medium is shown beneath the bars. Results are presented as percentage of efflux from mock-infected cells (taken as 100%) and are mean ± SD of triplicate determinations. An asterisk (*) indicates p < 0.001. (C) RAW 264.7 cells were transfected with plasmids expressing indicated Nef variants or an empty vector (mock-transfection). Twenty-four hours after transfection, LXR agonist, TO-901317 (1 μmol/L), was added. Cholesterol efflux to apoA-I (30 μg/ml) was performed for 3 h with cells 48 h after transfection as described in Materials and Methods. Means ± SD of quadruplicate determinations are shown. An asterisk (*) indicates p < 0.001. (D) Immunoblotting of RAW 264.7 cells transfected with empty vector (mock), WT Nef derived from HIV-1 strain SF2 (Nef.wt), or Nef.G2A mutant, and stained with anti-Nef antibodies.
Figure 2
Figure 2. Nef Targets ABCA1-Dependent Cholesterol Efflux
(A) Cholesterol efflux to HDL (30 μg/ml) was measured from HIV-1 ADA-infected and mock-infected macrophages used also to measure efflux to apoA-I in Figure 1A. (B) Impairment of phospholipid efflux in Nef-transfected RAW 264.7 cells. RAW 264.7 cells were transfected with plasmid expressing HIV-1 SF2-derived Nef or empty vector (mock-transfection). Phospholipid efflux to apoA-I (30 μg/ml) was measured as described in Methods. Means ± SD of quadruplicate determinations are shown. An asterisk (*) indicates p < 0.001. (C) Nef does not decrease cholesterol efflux in RAW 264.7 cells not treated with LXR agonist. Experiment was performed using HIV-1 SF2-derived Nef as described in Figure 1C, except that LXR agonist was not added. (D) Cholesterol efflux to apoA-I from HeLa cells. HeLa cells were either mock-transfected (mock) or co-transfected with ABCA1 and empty vector (ABCA1), or vector expressing Nef derived from HIV-1 SF2 (ABCA1 + NefSF2) or LAI strains (ABCA1 + NefLAI); cholesterol efflux to apoA-I was analyzed. An asterisk (*) indicates p < 0.001 (versus cells without ABCA1); a number sign (#) indicates p < 0.001 (versus cells without Nef). Expression of Nef determined by Western blot is shown beneath the bars. (E) Cholesterol efflux to HDL from HeLa cells. Experiment was performed as in (D), except that ABCG1 was used instead of ABCA1, and HDL (30 μg/ml) instead of apoA-I was used as cholesterol acceptor. An asterisk (*) indicates p < 0.01 (versus cells without ABCG1).
Figure 3
Figure 3. Nef Induces Down-Modulation of ABCA1
(A) Human monocyte-derived macrophages were infected with HIV-1 ADA or mock-infected and cultured for 14 d (RT in culture supernatant was 4,000 cpm/μl). ABCA1, ABCG1, SR-B1, and β-actin (loading control) were analyzed by Western blotting. (B) RAW 264.7 cells were transfected with vector expressing HIV-1 SF2-derived Nef (either WT or carrying a G2A mutation) or empty vector (mock). Twenty-four hours after transfection, cells were stimulated with TO-901317 (1 μM) and 24 h later, were analyzed by Western blotting for ABCA1 and β-actin (loading control). (C) ABCA1 RNA from HIV-infected macrophages used for Western blotting in (A) was analyzed by real-time RT-PCR. Results were adjusted according to β-actin signal and are presented in arbitrary units; an asterisk (*) indicates p < 0.01 (versus mock). (D) RNA was extracted from non-activated RAW 264.7 cells (control), mock-transfected RAW cells activated with LXR agonist TO-901317 (LXR), or cells transfected with SF2-derived Nef and activated with TO-901317 (LXR+NefSF2), and analyzed by real-time RT-PCR. Results were adjusted according to 28S RNA signal and are presented in arbitrary units; an asterisk (*) indicates p < 0.01 (versus LXR agonist-treated, mock-transfected cells).
Figure 4
Figure 4. The Effect of Nef on ABCA1 Localization
(A–D) On day 5 after infection with VSV-G-pseudotyped Nef-expressing (B and D) or ΔNef (A and C) HIV-1 SF2, cells were co-stained with anti-p24 mouse monoclonal and anti-ABCA1 rabbit polyclonal antibodies, followed by FITC-conjugated anti-mouse (A and B) and Cy5-conjugated anti-rabbit IgG (C and D). Arrows point to cells with re-localized ABCA1. The scale bars represent 20 μm. (E–G) Distribution of ABCA1 revealed by staining with monoclonal anti-ABCA1 antibody and FITC-conjugated anti-mouse IgG in RAW 264.7 cells transfected with empty vector (E), WT Nef derived from SF2 HIV-1 (Nef.wt, panel [F]), or SF2 Nef carrying a G2A mutation (Nef.G2A, [G]). Insets in (E and F) show cross-section of the image reconstituted from serial sectioning. Scale bars represent 20 μm. (H) [125-I]apoA-I binding (left panel) and internalization (right panel) in RAW 264.7 macrophages transfected with HIV-1 SF2-derived Nef. An asterisk (*) indicates p < 0.01.
Figure 5
Figure 5. Nef Interacts with ABCA1
(A) ABCA1 was immunoprecipitated using anti-FLAG M2 affinity gel from HeLa cells co-transfected with ABCA1-FLAG and an empty vector (mock), WT SF2 Nef (Nef.wt), or myristoylation-defective mutant Nef.G2A. Immunoprecipitates were analyzed by Western blotting for Nef (upper panel) or ABCA1 (middle panel) using specific antibodies. Bottom panel shows Nef expression in lysates of cells used for immunoprecipitation. (B) Experiment was performed as in Figure 4E, except that cells were incubated with monoclonal anti-ABCA1 and polyclonal anti-Nef antibody, followed by FITC-conjugated anti-rabbit and Cy5-conjugated anti-mouse antibodies. Since all transfected cells show re-localization of ABCA1 (Figure 4E), a typical single cell is shown here. Images were analyzed using software on the Zeiss LSM 510 microscope. The scale bar represents 20 μm. (C) Fluorescence profile of the image in Figure 5B was analyzed using the LSM 510 software. The top panel shows the distributions of the ABCA1 and HIV-1 Nef proteins in blue and green, respectively. The same analysis in the lower panel was performed for ABCA1 (blue) and Nef.G2A (green). The co-localization of WT Nef and ABCA1 at the plasma membrane is indicated by overlapping green and blue peaks at either end of the graph in the top panel.
Figure 6
Figure 6. Accumulation of Lipids in Cells Infected with HIV-1 or Transfected with Nef
(A–C) Oil Red O staining of HIV-infected macrophages. Uninfected (A) macrophages or cells infected with VSV-G–pseudotyped Nef-positive (B) or ΔNef (C) HIV-1 SF2 variants were loaded with cholesterol on day 3 after infection by incubating with AcLDL in the presence of apoA-I, and lipids were stained with Oil Red O 24 h later. p24 concentration in the culture supernatant on day 3 after infection was 4.7 ng/ml for cells inoculated with Nef-positive virus and 9.8 ng/ml for the culture inoculated with ΔNef HIV-1. (D–F) Electron microscopy of cholesterol-loaded uninfected macrophages (D) and cells infected with Nef-positive (E) and ΔNef (F) HIV-1 AD8 performed 14 d after infection. Uninfected cells have small numbers of electron-lucent lipid vacuoles (arrows). The cytoplasm of cells infected with Nef-positive virus is filled with electron-dense lipid vacuoles (arrows). Cells infected with ΔNef virus have small numbers of electron-lucent lipid vacuoles (arrows), similar in number to those in uninfected cells. The scale bars represent 5 μm. (G) The effect of Nef on cholesteryl ester synthesis. The rate of cholesteryl ester synthesis in RAW 264.7 cells transfected with an empty vector (mock-transfected) or Nef-expressing construct and incubated with or without AcLDL in the presence of apoA-I or 5% human plasma is presented as mean ± SD of quadruplicate determinations. An asterisk (*) indicates p < 0.02. (H) and (I) RAW 264.7 cells were transfected with empty vector (H) or Nef-expressing construct (I), stimulated with LXR agonist, incubated with AcLDL and lipid-free apoA-I, fixed with formaldehyde, and stained with Oil Red O.
Figure 7
Figure 7. Analysis of Lipids in RAW 264.7 Macrophages Transfected with Nef
(A) Cholesteryl ester content after 24 h incubation with AcLDL (50 μg/ml) determined by enzymatic assay; an asterisk (*) indicates p < 0.01. (B) Free cholesterol content after 24 h incubation with AcLDL (50 μg/ml) determined by enzymatic assay; an asterisk (*) indicates p < 0.05. (C) Triglyceride biosynthesis after 24 h incubation with AcLDL (50 μg/ml) measured as incorporation of [14C]oleic acid into triglycerides as described in Materials and Methods. (D) Uptake of AcLDL was calculated as a sum of 125I-AcLDL specifically taken up and degraded by cells. (E) Phospholipid biosynthesis measured as incorporation of [14C]choline into phospholipid fraction as described in Materials and Methods; an asterisk (*) indicates p < 0.01.
Figure 8
Figure 8. Identification of HIV-1–Positive Macrophages in Atherosclerotic Plaques of HIV-Infected Subjects.
Single (A–D) and double (E and F) immunostaining of aortic wall segments. (A) p24 staining. A low-magnification image showing the presence of p24+ cells in an area adjacent to the plaque lipid core. The scale bar represents 100 μm. (B) Detail of (A). p24+ cells show a characteristic morphology of foam cells. The scale bar represents 10 μm. (C) CD68 staining. CD68+ cells were identified in a parallel consecutive section to that shown in (A). The scale bar represents 100 μm. (D) Negative control (staining with an irrelevant primary antibody). The scale bar represents 100 μm. (E) Double immunostaining showing the co-localization of p24 (brown) with CD68 (rose). Immunostaining included a combination of a rabbit polyclonal anti-p24 antibody in the peroxidase–anti-peroxidase system with DAB chromogen yielding a brown reaction product, and a mouse monoclonal antibody to CD68 in the alkaline phosphatase–anti-alkaline phosphatase system with Fast Red chromogen, resulting in a rose precipitate. Counterstaining was with Mayer's hematoxylin. The scale bar represents 50 μm. (F) A detail of (E). The scale bar represents 15 μm.
Figure 9
Figure 9. Cholesterol Efflux and Infectivity of HIV Virions
Human monocyte-derived macrophages were infected with HIV-1 ADA or mock-infected, and 7 d after infection were treated or not treated with LXR agonist, TO-901317 (500 nM), for seven more days. (A) Cholesterol efflux to apoA-I was measured on day 21 after infection. An asterisk (*) indicates p < 0.01 (versus uninfected cells not treated with TO-901317); a number sign (#) indicates p < 0.01 (versus HIV-infected cells not treated with TO-901317). (B) Virions were collected from culture supernatants of LXR agonist-treated and untreated (control) cells on day 10 and day 14 (pooled together), adjusted according to p24 content, and analyzed for infectivity on indicator P4-CCR5 cells. Experiment was performed in triplicate, and results (mean ± SD) are presented as percent infectivity of virions produced by control cells; an asterisk (*) indicates p < 0.001. (C) Incorporation of [3H]cholesterol into virions produced by LXR agonist-treated and untreated (control) cells was measured in triplicate, and results (mean ± SD) are presented relative to cholesterol in the virions produced by control cells; an asterisk (*) indicates p < 0.001.

Comment in

Similar articles

Cited by

References

    1. Maziere JC, Landureau JC, Giral P, Auclair M, Fall L, et al. Lovastatin inhibits HIV-1 expression in H9 human T lymphocytes cultured in cholesterol-poor medium. Biomed Pharmacother. 1994;48:63–67. - PubMed
    1. Ono A, Freed EO. Plasma membrane rafts play a critical role in HIV-1 assembly and release. Proc Natl Acad Sci U S A. 2001;98:13925–13930. - PMC - PubMed
    1. Campbell SM, Crowe SM, Mak J. Virion-associated cholesterol is critical for the maintenance of HIV-1 structure and infectivity. AIDS. 2002;16:2253–2261. - PubMed
    1. Guyader M, Kiyokawa E, Abrami L, Turelli P, Trono D. Role for human immunodeficiency virus type 1 membrane cholesterol in viral internalization. J Virol. 2002;76:10356–10364. - PMC - PubMed
    1. Zheng YH, Plemenitas A, Fielding CJ, Peterlin BM. Nef increases the synthesis of and transports cholesterol to lipid rafts and HIV-1 progeny virions. Proc Natl Acad Sci U S A. 2003;100:8460–8465. - PMC - PubMed

Publication types

MeSH terms

Substances

Associated data