

Genetic modulation of hormone levels and life span in hybrids between laboratory and wild-derived mice
- PMID: 17077194
- PMCID: PMC2766814
- DOI: 10.1093/gerona/61.10.1019
Genetic modulation of hormone levels and life span in hybrids between laboratory and wild-derived mice
Abstract
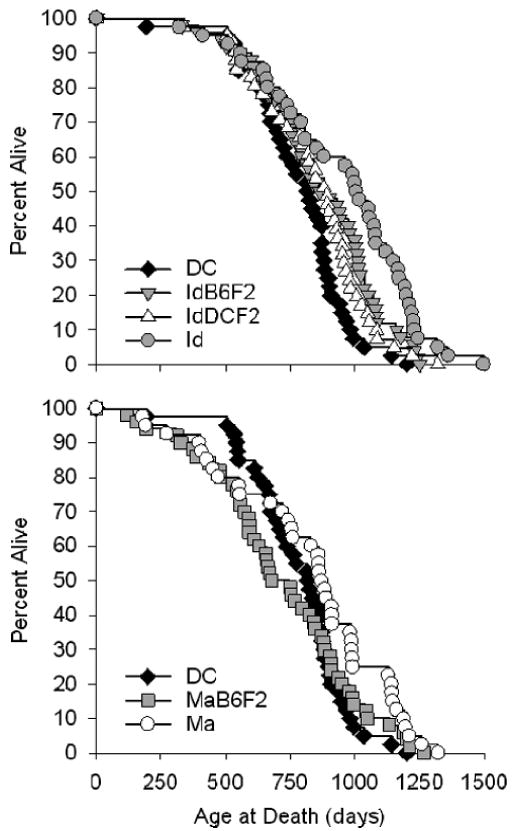
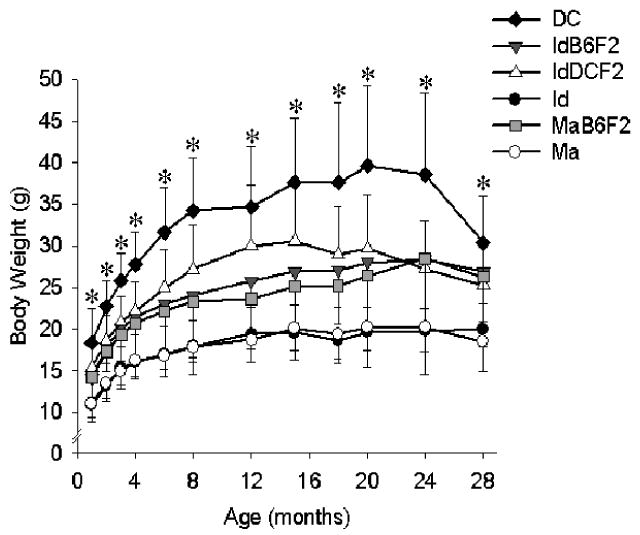
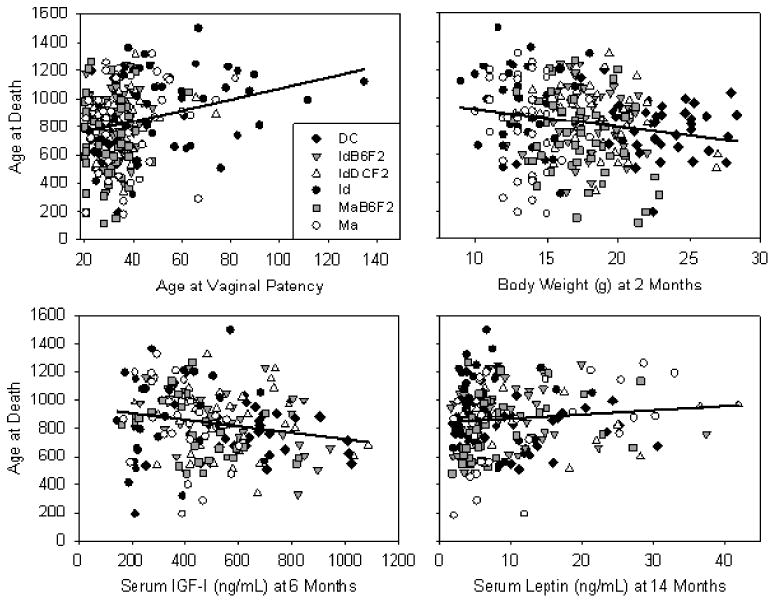
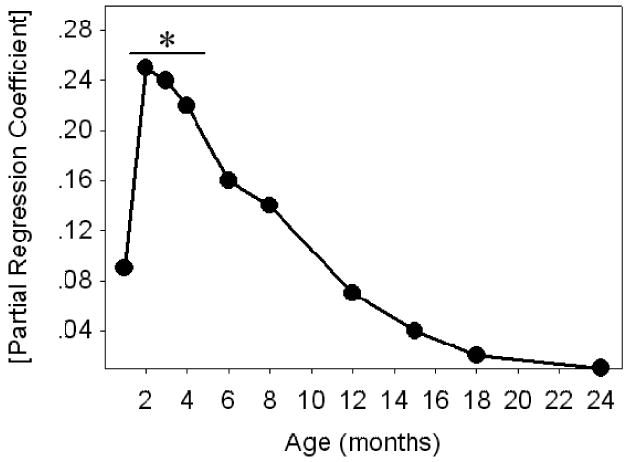
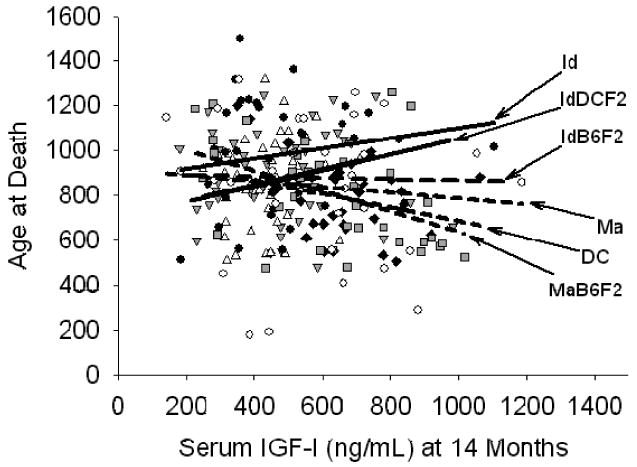
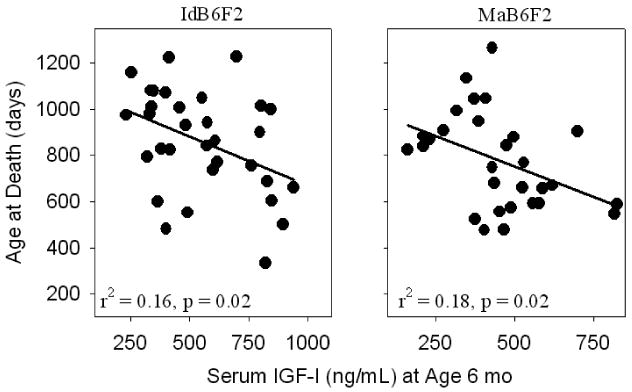
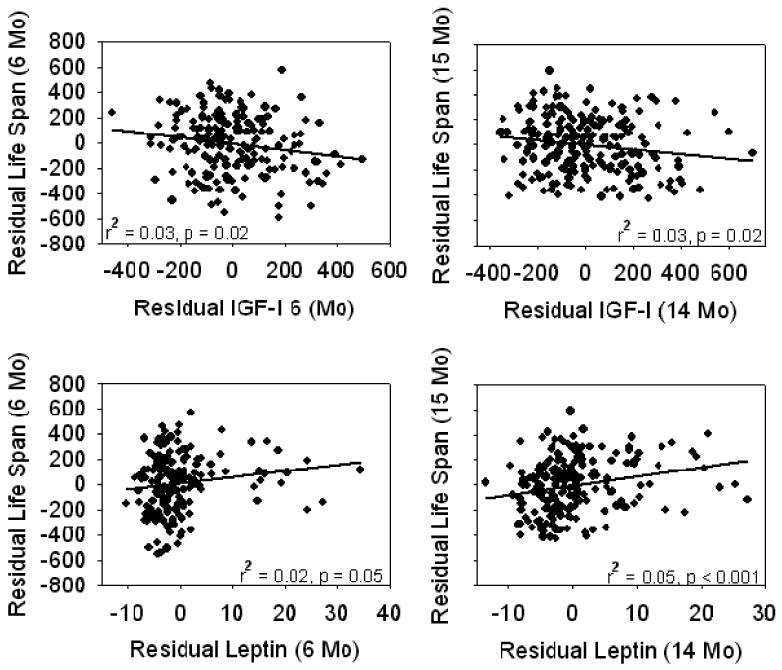
Previously we showed that mouse stocks derived from wild-caught progenitors are long-lived relative to genetically heterogeneous mice derived from laboratory-adapted strains. Here we replicate this life-span effect, and show that F2 hybrids between wild-derived and laboratory-derived stocks have intermediate survival patterns. Moreover, wild-derived mice are small, lean, and slow to mature, and have low serum insulin-like growth factor-I (IGF-I) relative to genetically heterogeneous mice. These traits, too, were at intermediate levels in the F2 hybrids. Furthermore, serum IGF-I at 6 months was a significant predictor of life span in two different populations of F2 hybrid mice. Pooling across stocks, life span was negatively correlated with body weight and serum IGF-I levels, and positively correlated with age at vaginal patency and serum leptin levels. Overall, these finding suggest that wild-derived mice harbor alleles that increase longevity, perhaps through effects on growth, maturation, and early-life hormone levels.
Figures
Similar articles
-
Longer life spans and delayed maturation in wild-derived mice.Exp Biol Med (Maywood). 2002 Jul;227(7):500-8. doi: 10.1177/153537020222700715. Exp Biol Med (Maywood). 2002. PMID: 12094015
-
Big mice die young: early life body weight predicts longevity in genetically heterogeneous mice.Aging Cell. 2002 Oct;1(1):22-9. doi: 10.1046/j.1474-9728.2002.00006.x. Aging Cell. 2002. PMID: 12882350
-
PohnB6F1: a cross of wild and domestic mice that is a new model of extended female reproductive life span.J Gerontol A Biol Sci Med Sci. 2007 Nov;62(11):1187-98. doi: 10.1093/gerona/62.11.1187. J Gerontol A Biol Sci Med Sci. 2007. PMID: 18000137
-
Exotic mice as models for aging research: polemic and prospectus.Neurobiol Aging. 1999 Mar-Apr;20(2):217-31. doi: 10.1016/s0197-4580(99)00038-x. Neurobiol Aging. 1999. PMID: 10537031 Review.
-
Models of growth hormone and IGF-1 deficiency: applications to studies of aging processes and life-span determination.J Gerontol A Biol Sci Med Sci. 2002 May;57(5):B177-88. doi: 10.1093/gerona/57.5.b177. J Gerontol A Biol Sci Med Sci. 2002. PMID: 11983714 Review.
Cited by
-
Deviation of innate circadian period from 24 h reduces longevity in mice.Aging Cell. 2012 Oct;11(5):794-800. doi: 10.1111/j.1474-9726.2012.00846.x. Epub 2012 Jul 12. Aging Cell. 2012. PMID: 22702406 Free PMC article.
-
A Single-Nucleus Transcriptomic Atlas Reveals Cellular and Genetic Characteristics of Alzheimer's-Like Pathology in Aging Tree Shrews.MedComm (2020). 2025 Mar 15;6(4):e70114. doi: 10.1002/mco2.70114. eCollection 2025 Apr. MedComm (2020). 2025. PMID: 40093585 Free PMC article.
-
How long will my mouse live? Machine learning approaches for prediction of mouse life span.J Gerontol A Biol Sci Med Sci. 2008 Sep;63(9):895-906. doi: 10.1093/gerona/63.9.895. J Gerontol A Biol Sci Med Sci. 2008. PMID: 18840793 Free PMC article.
-
Role of the GH/IGF-1 axis in lifespan and healthspan: lessons from animal models.Growth Horm IGF Res. 2008 Dec;18(6):455-71. doi: 10.1016/j.ghir.2008.05.005. Epub 2008 Aug 16. Growth Horm IGF Res. 2008. PMID: 18710818 Free PMC article. Review.
-
Fibroblasts from long-lived bird species are resistant to multiple forms of stress.J Exp Biol. 2011 Jun 1;214(Pt 11):1902-10. doi: 10.1242/jeb.054643. J Exp Biol. 2011. PMID: 21562178 Free PMC article.
References
-
- Silver LM. Mouse Genetics. New York: Oxford University Press; 1995.
-
- Miller RA, Harper JM, Dysko R, Durkee SJ, Austad SN. Longer life spans and delayed maturation in wild-derived mice. Exp Biol Med. 2002;227:500–508. - PubMed
-
- Miller RA, Chrisp C, Atchley WR. Differential longevity in mouse stocks selected for early life growth trajectory. J Gerontol Biol Sci. 2000;55A:B455–B461. - PubMed
-
- Dillin A, Kenyon C. Timing requirements for insulin/IGF-1 signaling in C. elegans. Science. 2002;298:830–834. - PubMed
Publication types
MeSH terms
Substances
Grants and funding
LinkOut - more resources
Full Text Sources
Miscellaneous
