

United States' trends and regional variations in lumbar spine surgery: 1992-2003
- PMID: 17077740
- PMCID: PMC2913862
- DOI: 10.1097/01.brs.0000248132.15231.fe
United States' trends and regional variations in lumbar spine surgery: 1992-2003
Abstract
Study design: Repeated cross-sectional analysis using national Medicare data from the Dartmouth Atlas Project.
Objective: To describe recent trends and geographic variation in population-based rates of lumbar fusion spine surgery.
Summary of background data: Lumbar fusion rates have increased dramatically during the 1980s and even more so in the 1990s. The most rapid increase appeared to follow the approval of a new surgical implant device.
Methods: Medicare claims and enrollment data were used to calculate age, sex, and race-adjusted rates of lumbar laminectomy/discectomy and lumbar fusion for fee-for-service Medicare beneficiaries over age 65 in each of the 306 US Hospital Referral Regions between 1992 and 2003.
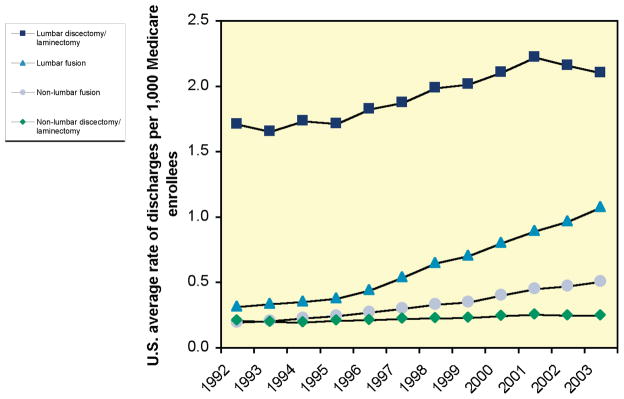
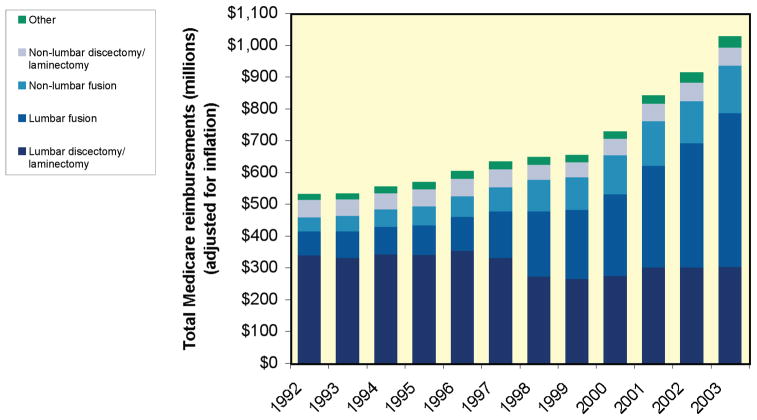
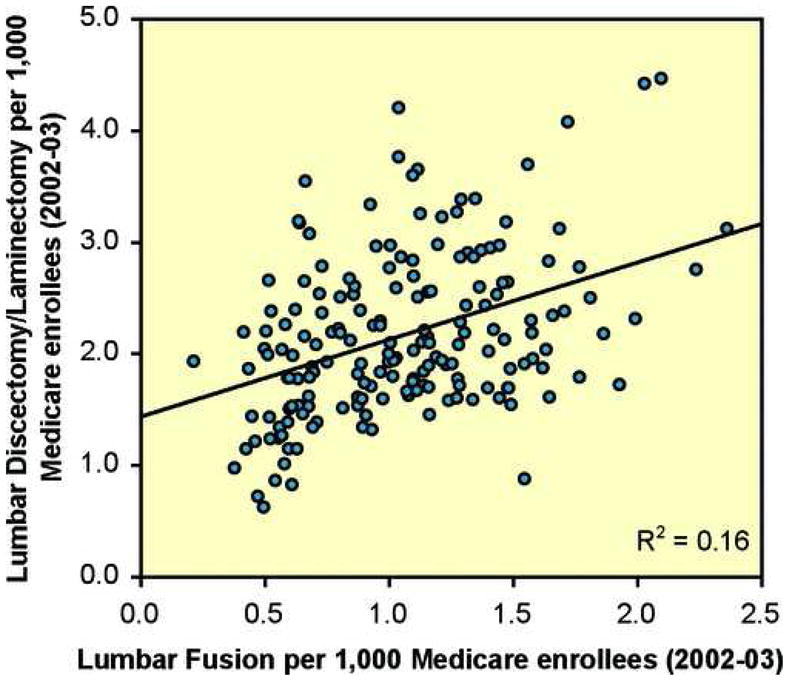
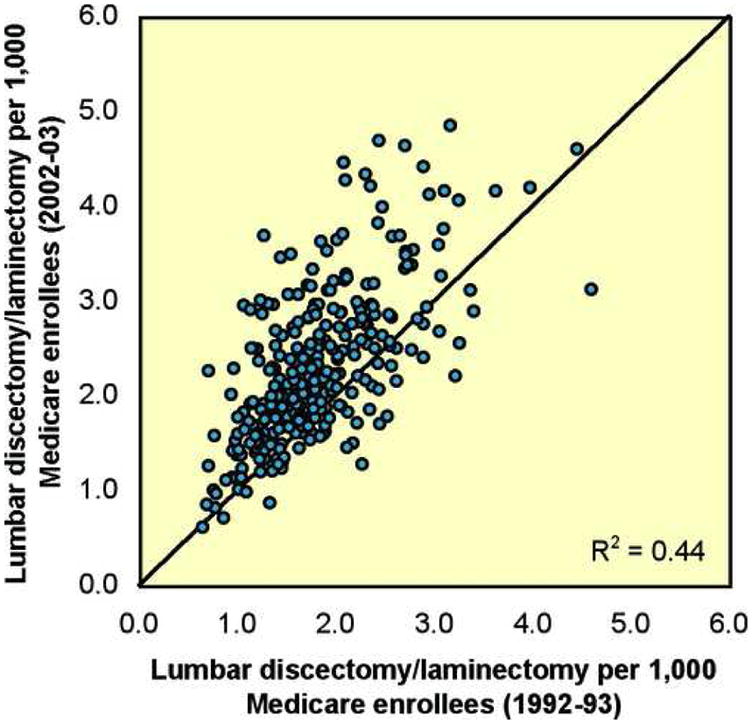
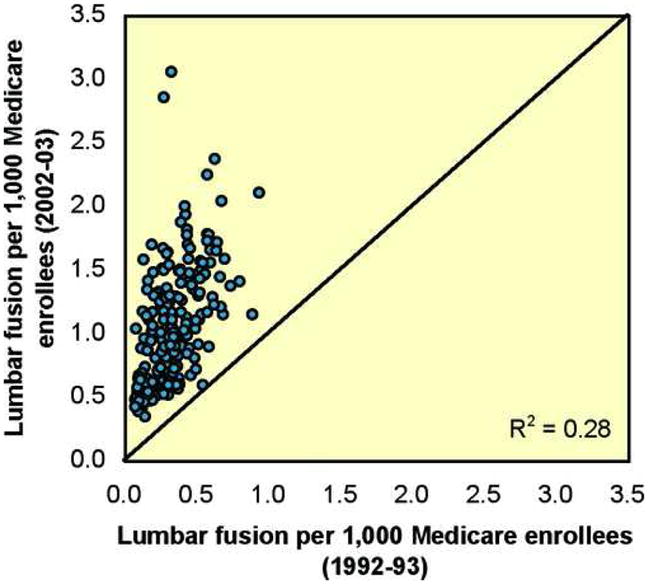
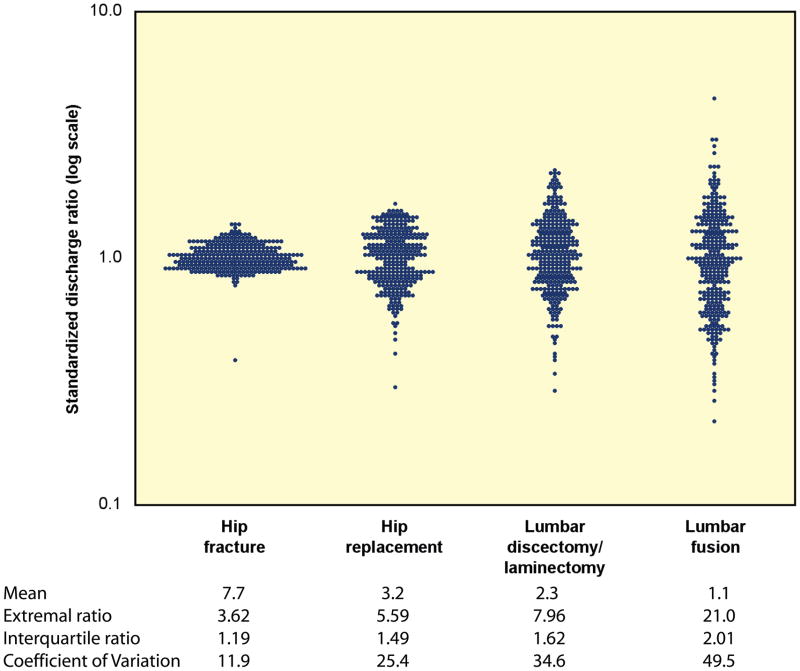
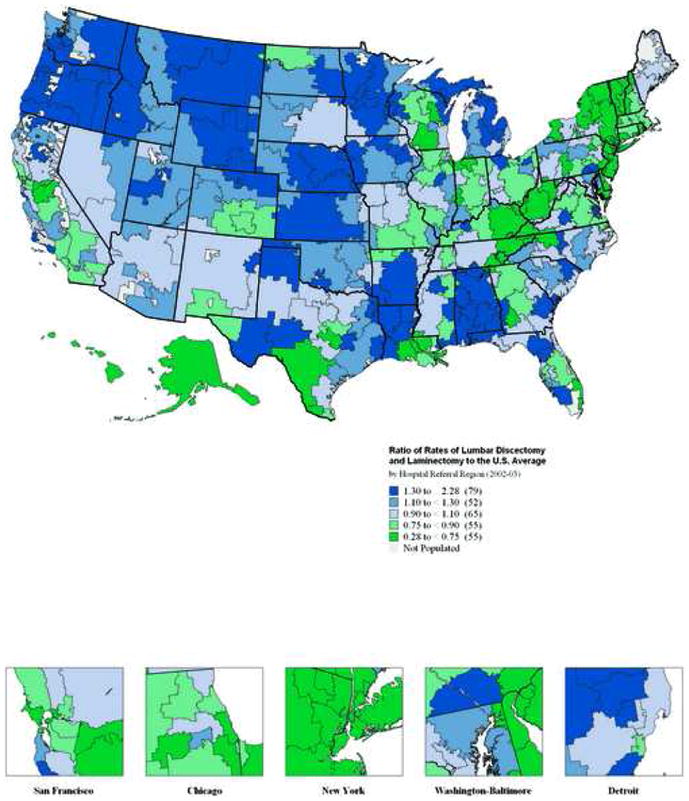
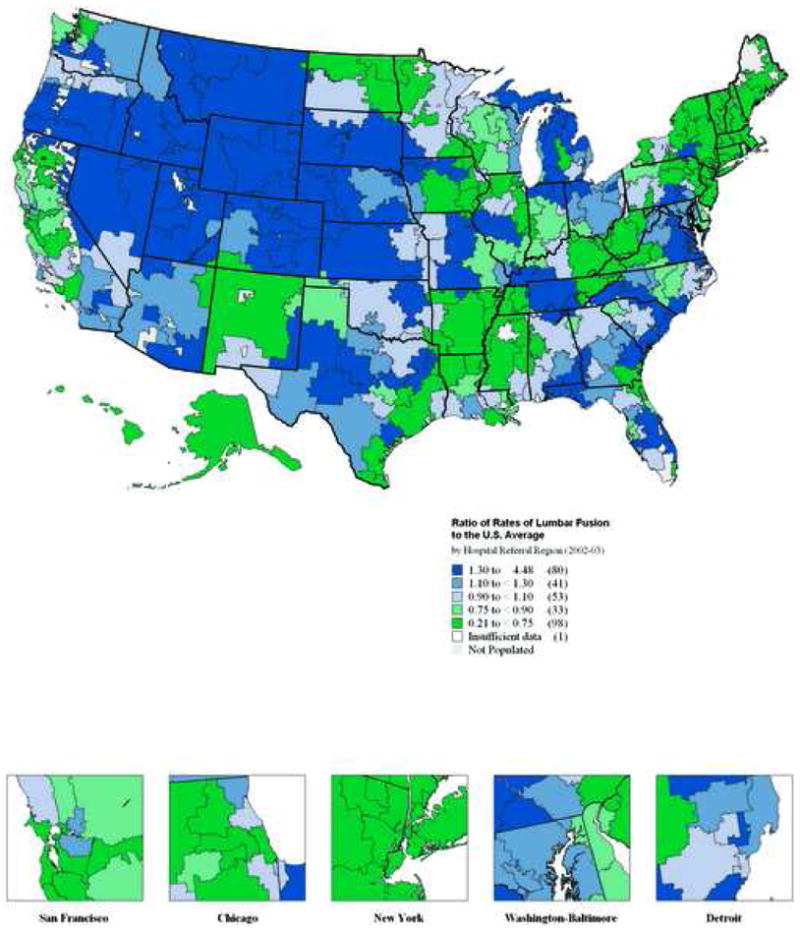
Results: Lumbar fusion rates have increased steadily since 1992 (0.3 per 1000 enrollees in 1992 to 1.1 per 1000 enrollees in 2003). Regional rates of lumbar discectomy, laminectomy, and fusion in 1992-1993 were highly correlated to rates of discectomy, laminectomy (R2 = 0.44), and fusion (R2 = 0.28) in 2002-2003. There was a nearly 8-fold variation in regional rates of lumbar discectomy and laminectomy in 2002 and 2003. In the case of lumbar fusion, there was nearly a 20-fold range in rates among Medicare enrollees in 2002 and 2003. This represents the largest coefficient of variation seen with any surgical procedure. Medicare spending for inpatient back surgery more than doubled over the decade. Spending for lumbar fusion increased more than 500%, from 75 million dollars to 482 million dollars. In 1992, lumbar fusion represented 14% of total spending for back surgery; by 2003, lumbar fusion accounted for 47% of spending.
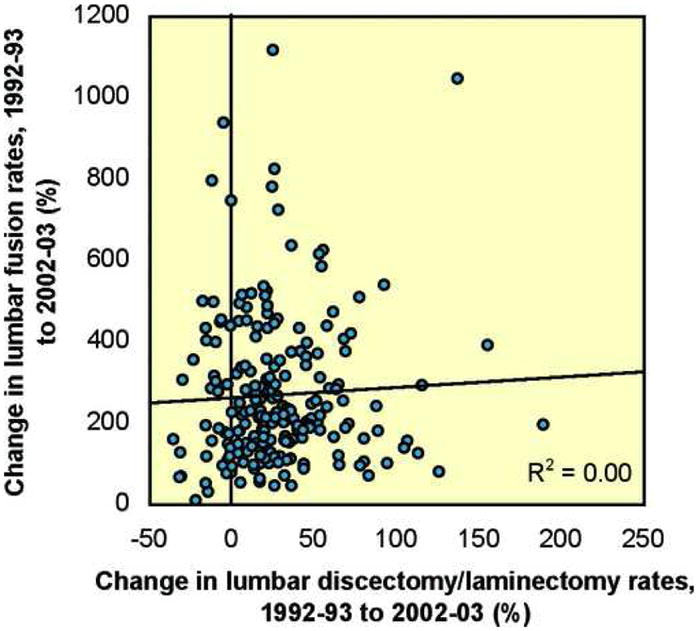
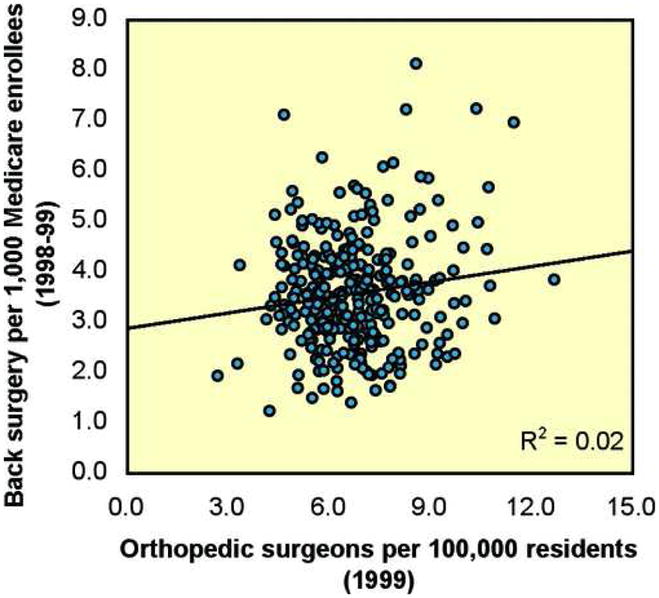
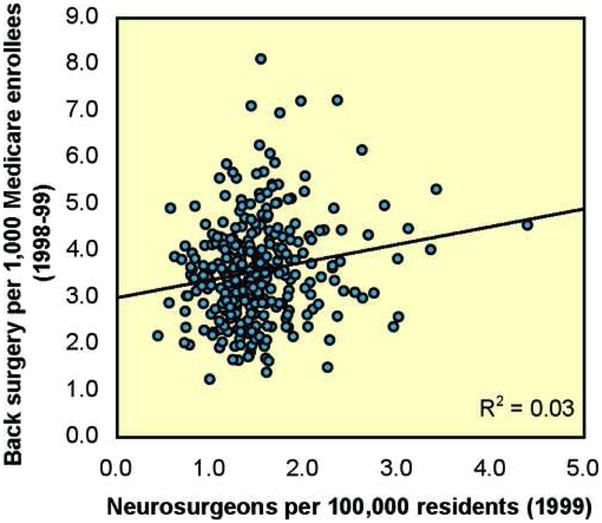
Conclusions: The rate of specific procedures within a region or "surgical signature" is remarkably stable over time. However, there has been a marked increase in rates of fusion, and a coincident shift and increase in cost. Rates of back surgery were not correlated with the per-capita supply of orthopedic and neurosurgeons.
Figures
References
-
- Boden S, McCowin P, Davis D. Abnormal magnetic-resonance scans of the lumbar spine in asymptomatic subjects: A prospective investigation. Journal of Bone and Joint Surgery. 1990;72A:403–8. - PubMed
-
- Deyo RA, Weinstein JN. Low back pain. N Engl J Med. 2001;344:363–70. - PubMed
-
- Jensen M, Brant-Zawadzki M, Obuchowski N. Magnetic resonance imaging of the lumbar spine in people without back pain. New England Journal of Medicine. 1994;331:69–73. - PubMed
-
- Weinstein JN, Bronner KK, Morgan TS, Wennberg JE. Trends and geographic variations in major surgery for degenerative diseases of the hip, knee, and spine. Health Aff (Millwood) 2004;(Suppl Web Exclusive):VAR81–9. - PubMed
-
- Cherkin DC, Deyo RA, Loeser JD, Bush T, Waddell G. An International Comparison of Back Surgery Rates. Spine. 1994;19:1201–6. - PubMed
Publication types
MeSH terms
Grants and funding
LinkOut - more resources
Full Text Sources
Other Literature Sources
Medical
Research Materials
