

Seroprevalence of Mycobacterium avium subspecies paratuberculosis, Neospora caninum, Bovine leukemia virus, and Bovine viral diarrhea virus infection among dairy cattle and herds in Alberta and agroecological risk factors associated with seropositivity
- PMID: 17078247
- PMCID: PMC1571121
Seroprevalence of Mycobacterium avium subspecies paratuberculosis, Neospora caninum, Bovine leukemia virus, and Bovine viral diarrhea virus infection among dairy cattle and herds in Alberta and agroecological risk factors associated with seropositivity
Abstract
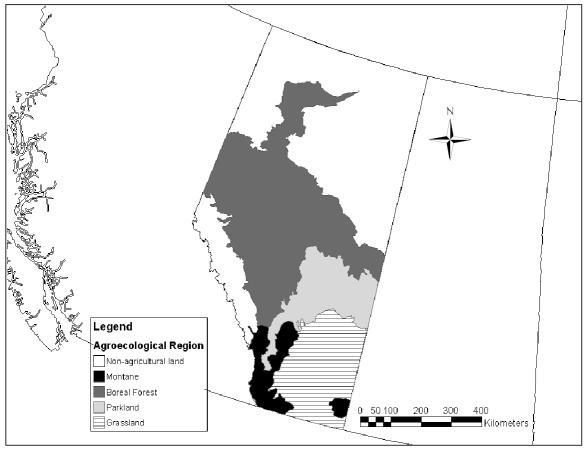
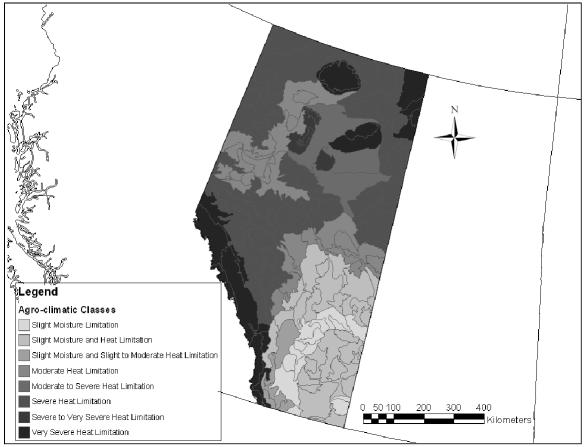
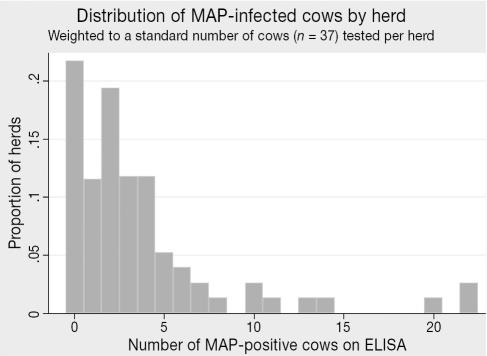
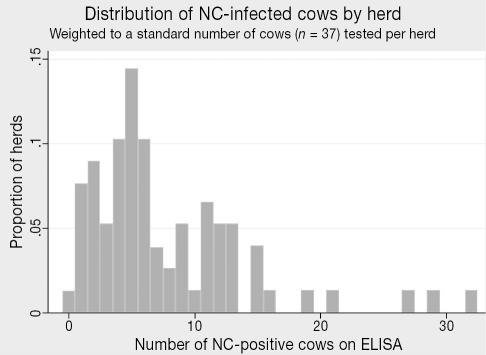
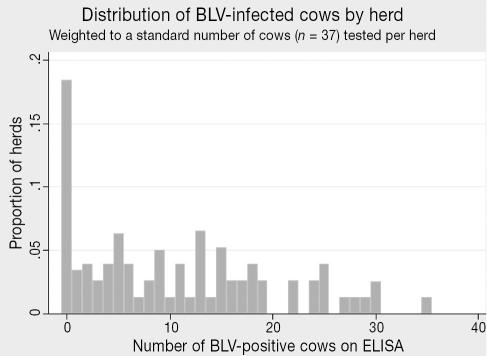
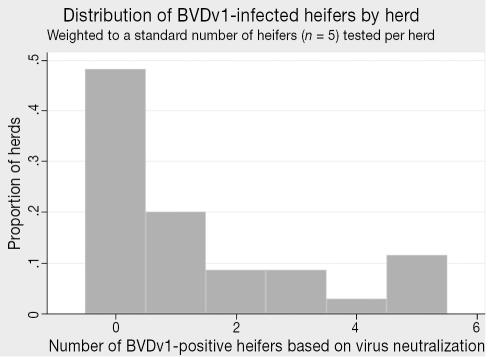
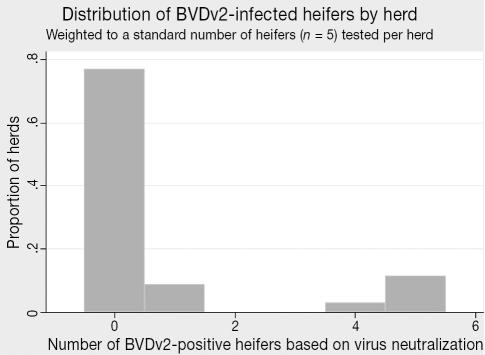
A province-wide, cross-sectional seroprevalence and agroecological risk factor study of Mycobacterium avium subspecies paratuberculosis (MAP), Neospora caninum (NC), Bovine leukemia virus (BLV), and Bovine viral diarrhea virus (BVDv) genotypes 1 and 2 (BVDv1 and BVDv2) infection in dairy cattle herds in Alberta was conducted. Among adults, the seroprevalence of MAP, NC, and BLV was 9.1%, 18.5%, and 26.9%, respectively. For MAP, based on a herd test cutpoint of 2 or more seropositive cows, 58.8% of herds were infected. Herd-level seroprevalence for NC and BLV was 98.7% and 86.7%, respectively, based on a herd-test cutpoint of 1 seropositive cow. Among unvaccinated dairy heifers, the seroprevalence for BVDv1 and BVDv2 infection was 28.4% and 8.9%, respectively, while herd-level infection was 53.4% and 19.7%. Seroprevalence for MAP varied moderately by agroecological region, whereas that for NC, BLV, and BVDv1 and BVDv2 did not. For MAP, aridity and soil pH (correlated features of the region) were also important.
Séroprévalence des infections à Mycobacterium avium sous-espèce paratuberculosis, à Neospora caninum, au virus de la leucémie bovine et au virus de la diarrhée bovine virale parmi les bovins et les troupeaux laitiers de l’Alberta et facteurs de risques agroécologiques associés à la séropositivité. Une étude de séroprévalence transversale et de facteurs de risques agroécologiques a été menée à la grandeur de l’Alberta sur l’infection des troupeaux laitiers par Mycobacterium avium sous-espèce paratuberculosis (MAP), Neospora caninum (NC), le virus de la leucémie bovine (VLB) et le virus de la diarrhée bovine virale (VDBv) génotype 1 et 2 (VDBV1 et VDBV2). Parmi les adultes, la séroprévalence au MAP, NC et VLB était respectivement de 9,1, 18,5 et 26,9 %. Pour le MAP, avec un seuil de 2 vaches positives ou plus par troupeau, 58,8 % des troupeaux étaient infectés. Le niveau de séroprévalence de troupeaux pour NC et le VLB était respectivement à 98,7 et 86,7 %, avec un seuil d’une vache séropositive par troupeau. Parmi les génisses laitières non vaccinées, la séroprévalence pour les infections au VDBV1 et VDBV2 était respectivement de 28,4 et 8,9 % alors que le taux d’infection des troupeaux était de 53,4 et 19,7 %. La séroprévalence du MAP varie modérément selon les régions agroécologiques alors que pour NC, le VLB et le VDBV1 et VDBV2 la séroprévalence ne variait pas. Pour MAP, l’aridité et le pH du sol (caractéristiques combinées des régions) étaient également importants.
(Traduit par Docteur André Blouin)
Figures
References
-
- Alberta Johne’s Control Program [homepage on the Internet]. Edmonton, AB: Government of Alberta c2004–2005 [updated 2004 June 28]. Available from http://www1.agric.gov.ab.ca/$department/deptdocs.nsf/all/afs5602?opendoc... Last accessed 03/06/2006.
-
- Radostits OM, Gay CC, Blood DC, Hinchcliff KW. Veterinary Medicine: a Textbook of the Diseases of Cattle, Sheep, Pigs, Goats and Horses, 9th ed. London, UK: WB Saunders, 2000:922–934, 1046–1058, 1085–1105, 1308–1310.
-
- OIE. Manual of Diagnostic Tests and Vaccines for Terrestrial Animals (Mammals, Birds and Bees). Paris, France: Office International des Epizooties, 2004:347–359, 464–473. - PubMed
-
- Stabel JR. Johne’s disease: a hidden threat. J Dairy Sci. 1998;81:283–288. - PubMed
Publication types
MeSH terms
Substances
LinkOut - more resources
Full Text Sources