. 2007 Jan 19;365(3):621-36.
doi: 10.1016/j.jmb.2006.10.004. Epub 2006 Oct 6.

Characteristics affecting expression and solubilization of yeast membrane proteins

Affiliations

Characteristics affecting expression and solubilization of yeast membrane proteins

Michael A White et al. J Mol Biol. .

Abstract

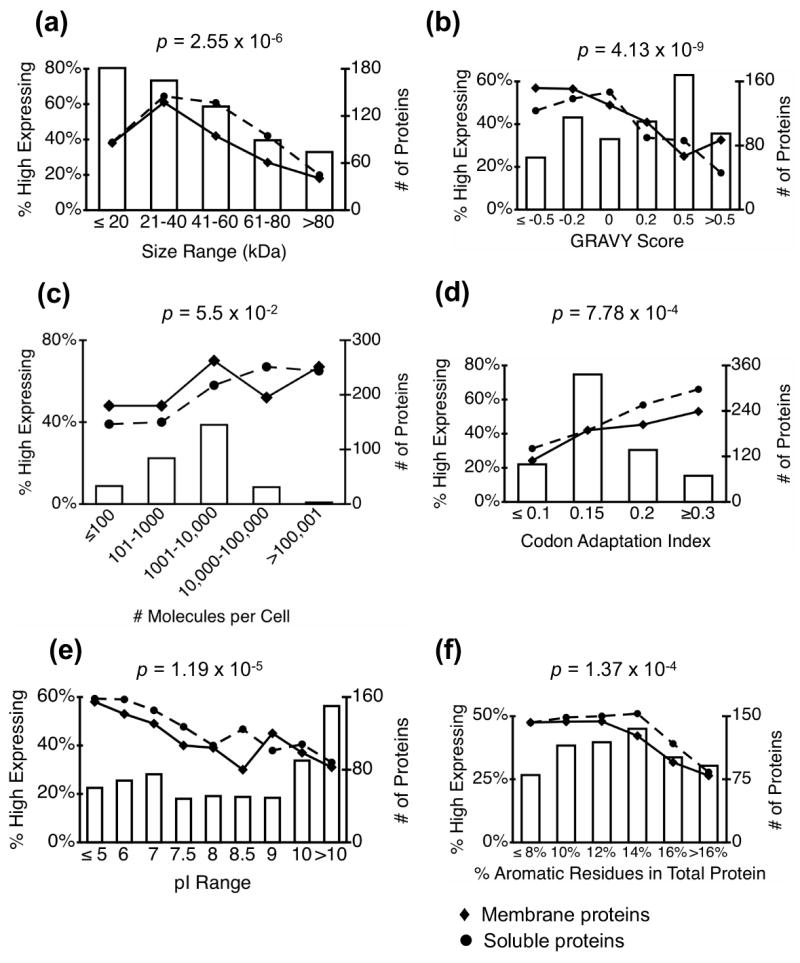
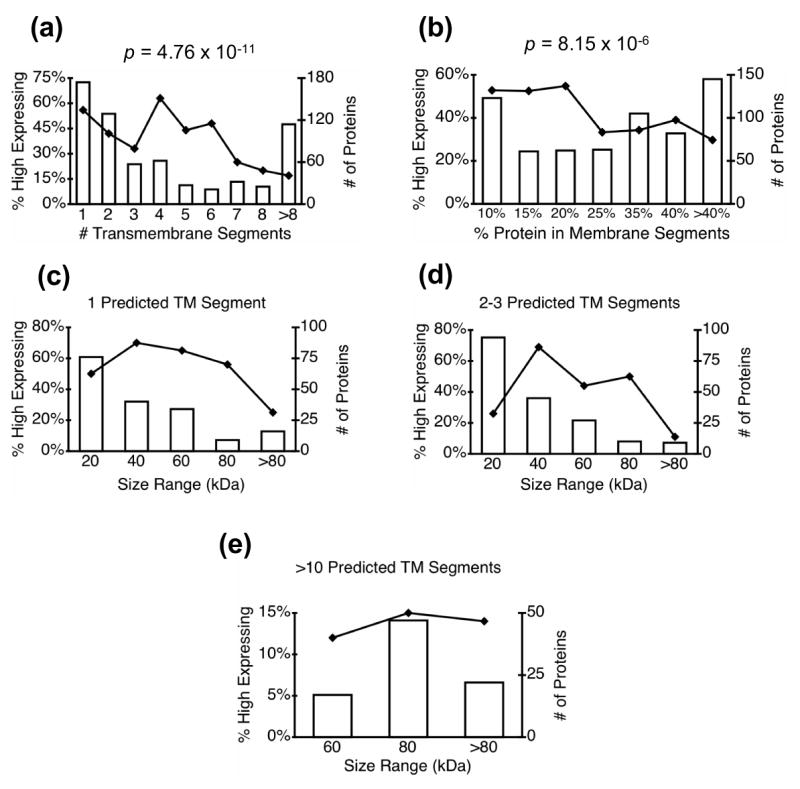
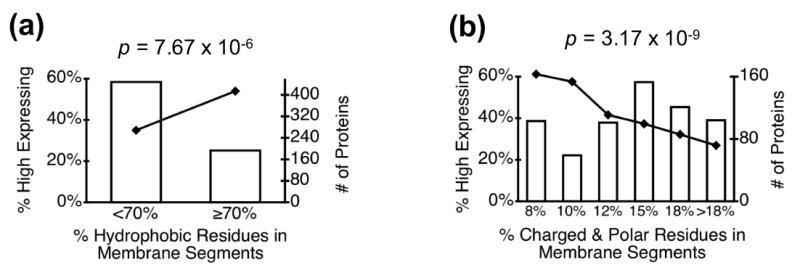
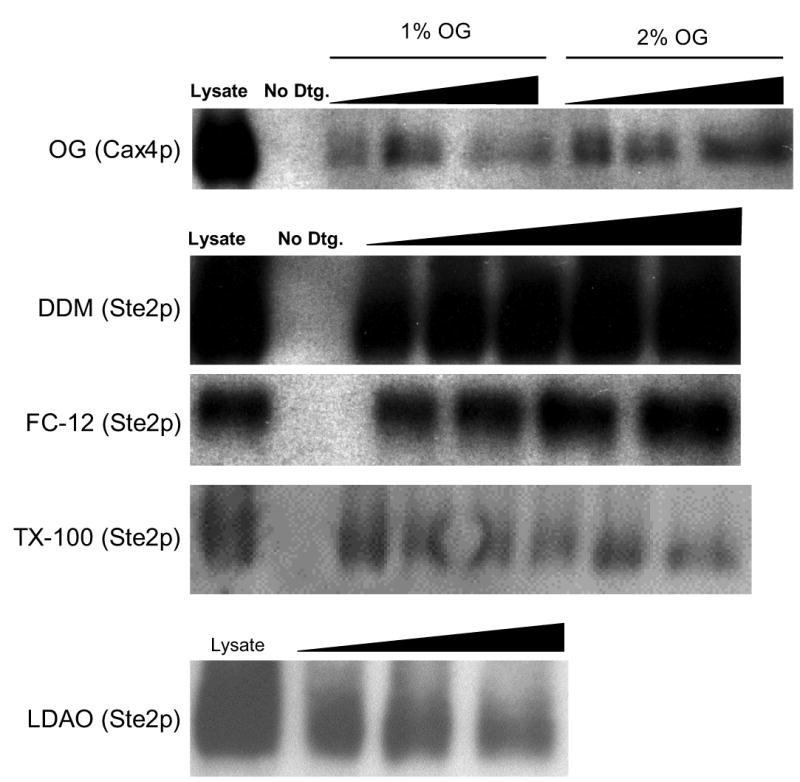
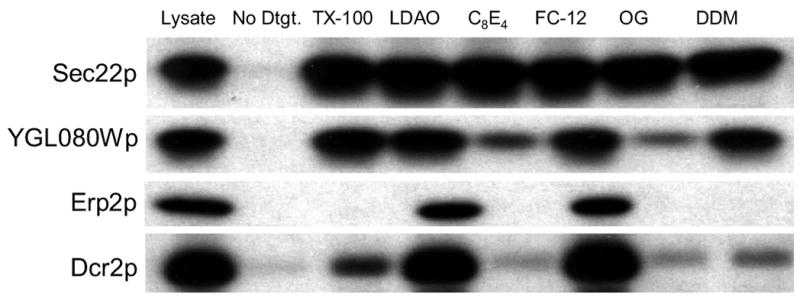
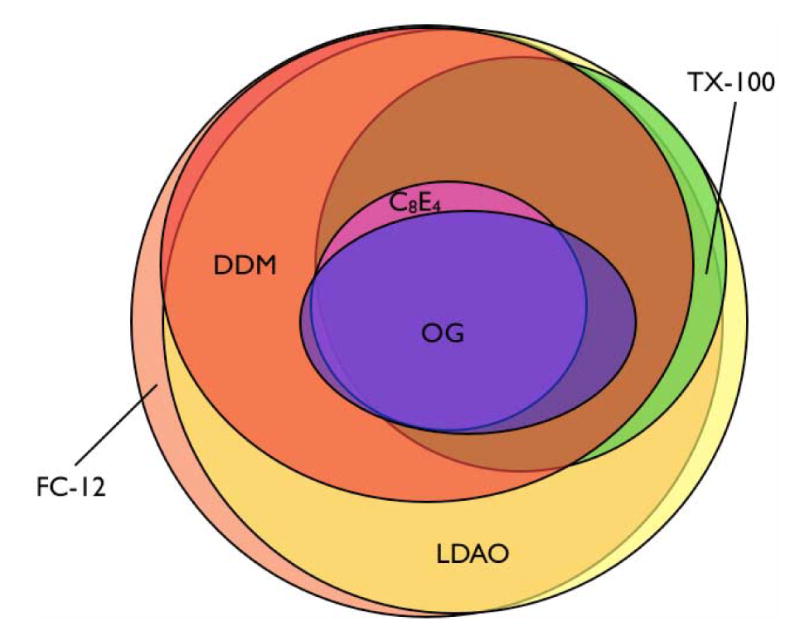
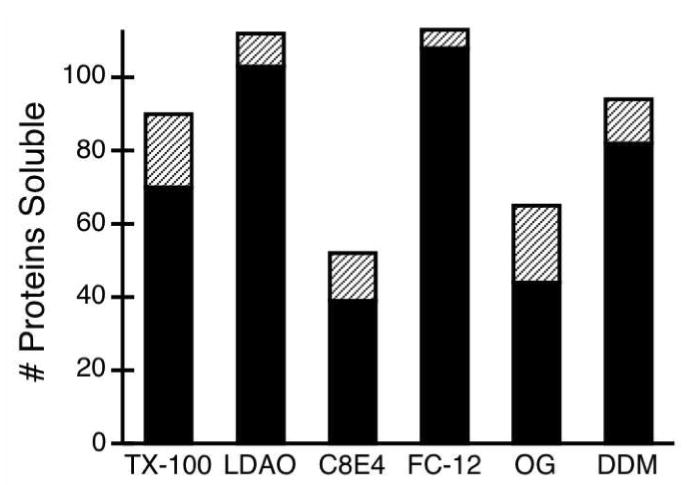
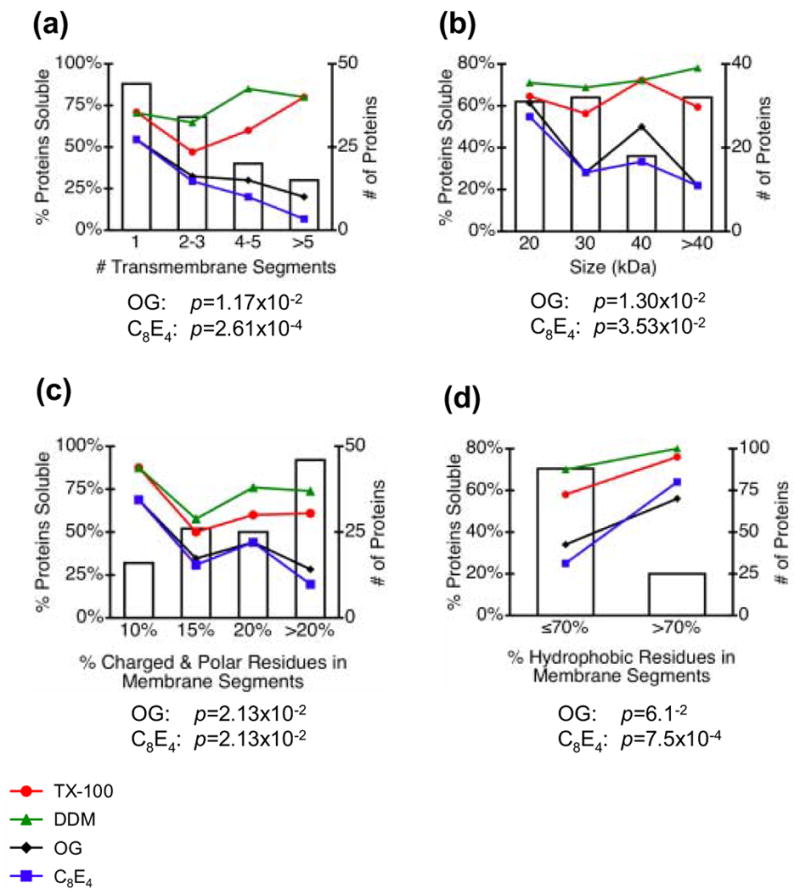
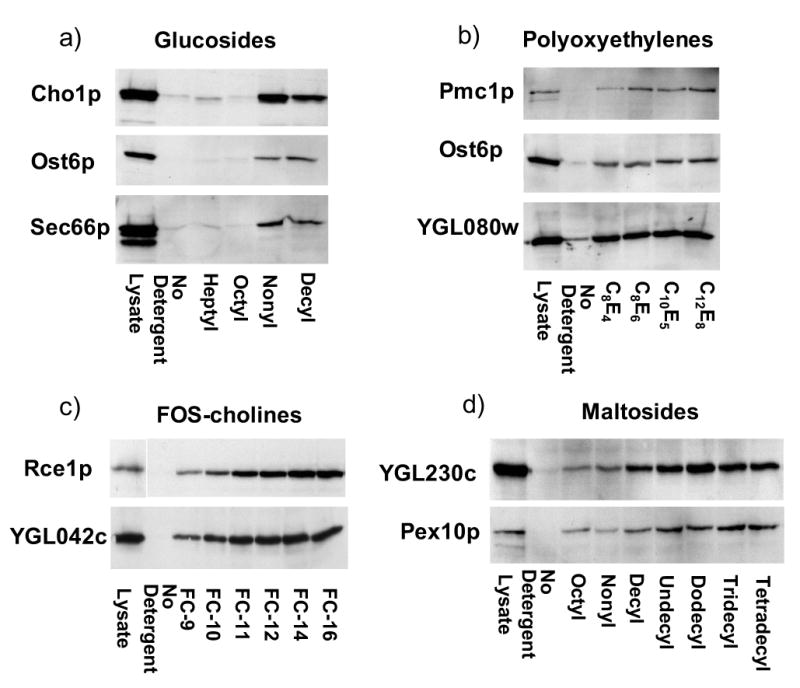
Biochemical and structural analysis of membrane proteins often critically depends on the ability to overexpress and solubilize them. To identify properties of eukaryotic membrane proteins that may be predictive of successful overexpression, we analyzed expression levels of the genomic complement of over 1000 predicted membrane proteins in a recently completed Saccharomyces cerevisiae protein expression library. We detected statistically significant positive and negative correlations between high membrane protein expression and protein properties such as size, overall hydrophobicity, number of transmembrane helices, and amino acid composition of transmembrane segments. Although expression levels of membrane and soluble proteins exhibited similar negative correlations with overall hydrophobicity, high-level membrane protein expression was positively correlated with the hydrophobicity of predicted transmembrane segments. To further characterize yeast membrane proteins as potential targets for structure determination, we tested the solubility of 122 of the highest expressed yeast membrane proteins in six commonly used detergents. Almost all the proteins tested could be solubilized using a small number of detergents. Solubility in some detergents depended on protein size, number of transmembrane segments, and hydrophobicity of predicted transmembrane segments. These results suggest that bioinformatic approaches may be capable of identifying membrane proteins that are most amenable to overexpression and detergent solubilization for structural and biochemical analyses. Bioinformatic approaches could also be used in the redesign of proteins that are not intrinsically well-adapted to such studies.


Figures

Figure 1
Figure 1. Protein expression dependence on general protein properties
Bar graphs show the total number of predicted membrane proteins (high expressers + low expressers, right axis) in each bin; line plots show the proportion of high expressers for membrane proteins (♦ solid line) and soluble proteins (●, dashed line) as a function of the specified protein property. The indicated p-values refer to membrane protein plots> They were determined by a chi-squared test for trend in proportions as described in Materials and Methods.
Figure 2
Figure 2. Protein expression dependence on protein size and number of transmembrane segments
Bar graphs show the total number of predicted membrane proteins (high expressers + low expressers, right axis) in each bin; line plots show the proportion of high expressing membrane proteins as a function of the specified property. The indicated p-values were determined as described in Materials and Methods. In panels c-e, the effects of protein size were examined for proteins that contain set numbers of predicted transmembrane segments.
Figure 3
Figure 3. Protein expression dependence on hydrophobicity of predicted transmembrane segments
Bar graphs show the total number of predicted membrane proteins (high expressers + low expressers, right axis) in each bin; line plots show the proportion of high expressing membrane proteins as a function of the specified property.
Figure 4
Figure 4. Titrations testing detergent:lysate ratio for solubilizing conditions
Little variation in solubility was observed for most detergents over a broad range of detergent:lysate volume ratios. Each panel shows the results of a representative immunoblot comparing total lysate to supernatants from centrifuged samples treated with detergent-free buffer or varying ratios of detergent:lysate solutions. The black triangles indicate the increasing ratios of volumes of stock detergent to lysate across the lanes of the gel. The actual ratios used were: 1% and 2% OG- 6:1, 17:1, 40:1; 1% DDM- 9:1, 10:1, 13:1, 18:1, 30:1; 1% FC12- 5:1, 8:1, 17:1, 40:1. Results for titrations with C8E4 are not shown, since none of initial trial proteins were significantly soluble in this detergent.
Figure 5
Figure 5. Representative detergent solubility patterns
Each panel shows the results of an immunoblot for one protein comparing total lysate to the supernatant of solubilized samples or a non-solubilized negative control after centrifugation at 109,000×g for 1 hour. Fully solubilized samples show a band intensity equal to the lysate control, while poorly solubilized samples show a weak band intensity. The solubility of the samples was scored on a scale of 0–4, with 4 indicating full solubilization, as described in Materials and Methods.
Figure 6
Figure 6. Overlap of soluble protein sets among six different detergents
The Venn diagram visually illustrates overlapping solubilities among all six detergents tested. Three proteins were insoluble in all detergents, and one protein, Pmp2p, was soluble in all detergents except FC-12 and DDM; these proteins are not represented in the diagram.
Figure 7
Figure 7. Solubilization efficiency of detergents
Black bars indicate the number of proteins at least 50% soluble in a given detergent (score of 3 or 4) out of a possible 113 proteins. Hatched bars show the number of proteins that were marginally soluble in a given detergent (score of 2). The zwitterionic detergents LDAO and FC-12 were the most effective solubilizers.
Figure 8
Figure 8. Dependence of solubility on protein properties
Bar graphs show the total number of proteins tested for solubility in each bin; line plots show the percentage of proteins soluble for DDM (▲, green), TX-100 (●, red), OG (♦, black) and C8E4 (■, blue) as a function of the specified protein characteristic. Correlations between DDM and TX-100 solubility and these protein properties were not statistically significant; p-values for OG and C8E4 were determined by a chi-squared test for trend in proportions as described in Materials and Methods.
Figure 9
Figure 9. Effects of detergent tail lengths on membrane protein solubilization
Proteins exhibiting limited solubility in OG and C8E4 were further tested for solubilities in families of related detergents with different tail lengths as described in Materials and Methods. In each case, the total protein in an equivalent amount of lysate is shown in the left-hand lane. Panels show experiments in the following detergent families: a. glucosides, b. polyoxyethylenes, c. FOS-choline series, d. maltosides.
Figure 10
Figure 10. Three known membrane ATPases are expressed in active form
Membranes isolated from strains expressing the known membrane ATPases Pma1p, Adp1p, and Ena5p, exhibit specific ATP hydrolysis activities above the activity found in membranes isolated from a control strain expressing the pheromone receptor Ste2p. Each assay was performed in duplicate as described in Materials and Methods. a. Pma1p and the Ste2p control were assayed at pH 6. b. Adp1p, Ena5p, and the Ste2p control were assayed at pH 7.5.

References

    1. Loll PJ. Membrane protein structural biology: the high throughput challenge. J Struct Biol. 2003;142:144–53. - PubMed
    1. White SH. The progress of membrane protein structure determination. Protein Sci. 2004;13:1948–9. - PMC - PubMed
    1. Wiener MC. A pedestrian guide to membrane protein crystallization. Methods. 2004;34:364–72. - PubMed
    1. Werten PJ, Remigy HW, de Groot BL, Fotiadis D, Philippsen A, Stahlberg H, Grubmuller H, Engel A. Progress in the analysis of membrane protein structure and function. FEBS Lett. 2002;529:65–72. - PubMed
    1. Canaves JM, Page R, Wilson IA, Stevens RC. Protein biophysical properties that correlate with crystallization success in Thermotoga maritima: maximum clustering strategy for structural genomics. J Mol Biol. 2004;344:977–91. - PubMed

Publication types

MeSH terms