Review
. 2007 Jan;113(1):197-209.
doi: 10.1016/j.pharmthera.2006.08.002. Epub 2006 Sep 7.

Interactions between drugs and occupied receptors

Affiliations
Review

Interactions between drugs and occupied receptors

Ronald J Tallarida. Pharmacol Ther. 2007 Jan.

Abstract

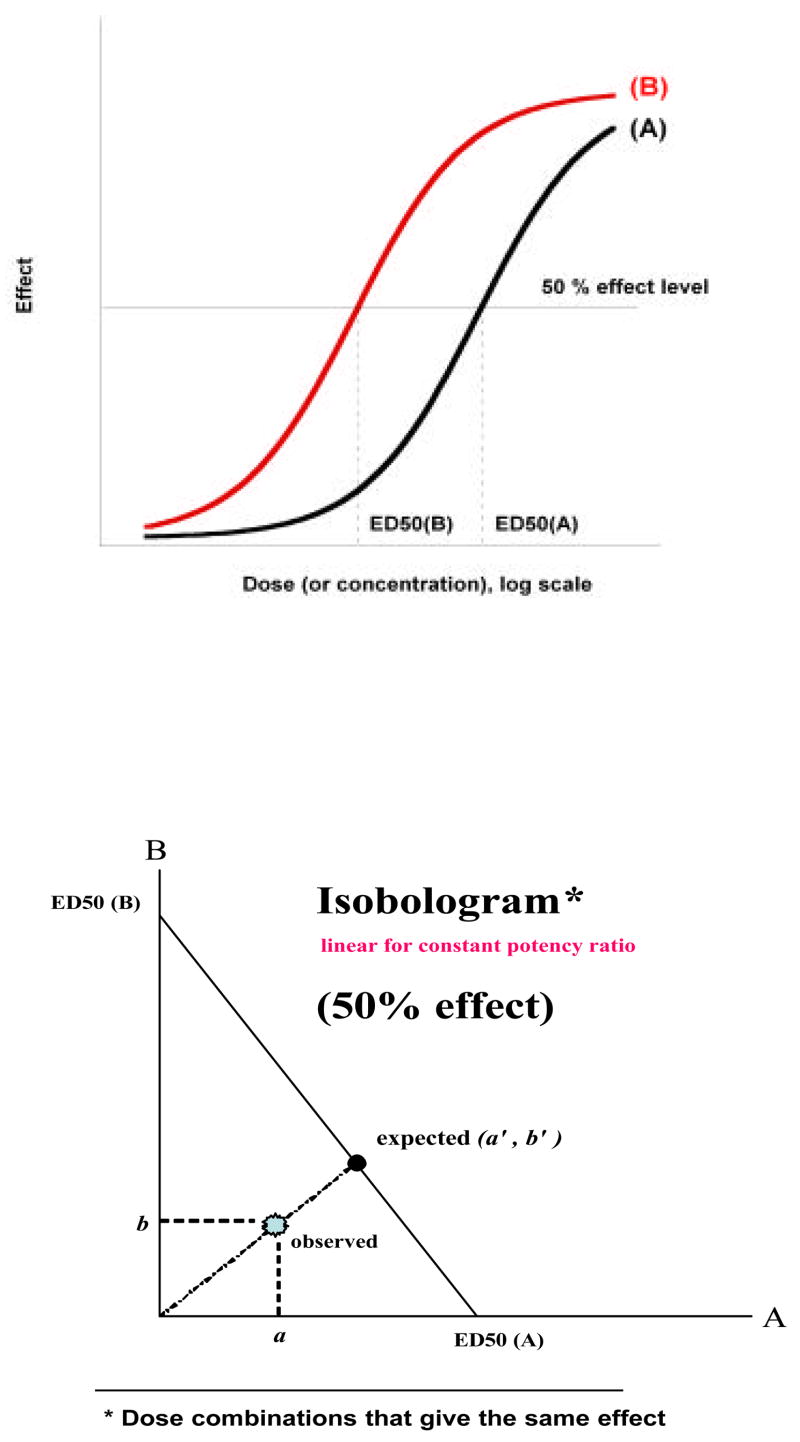
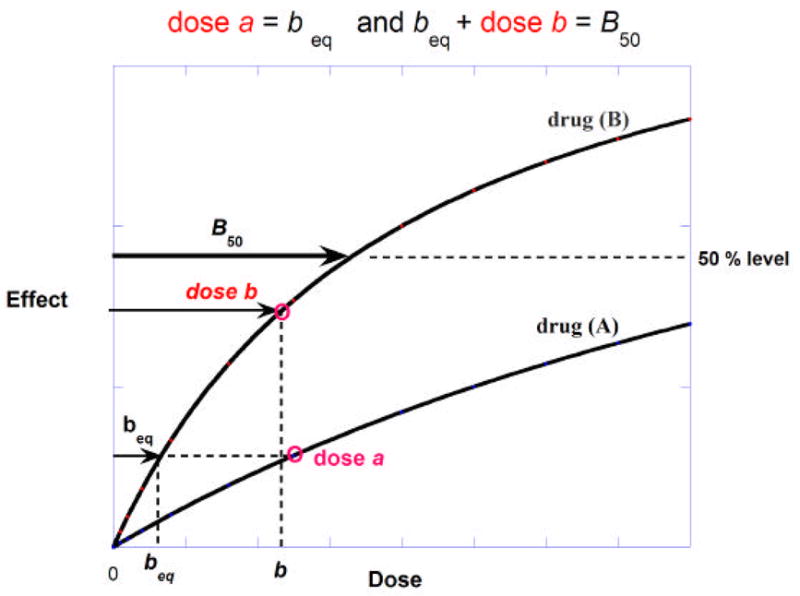
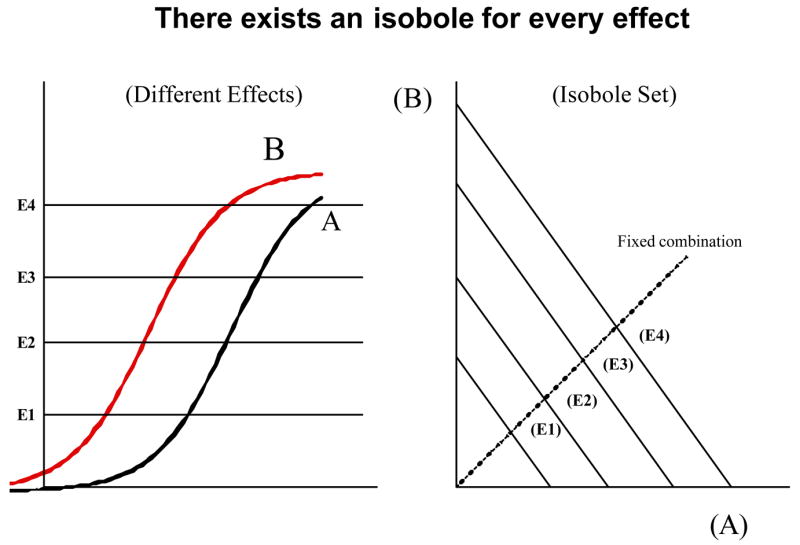
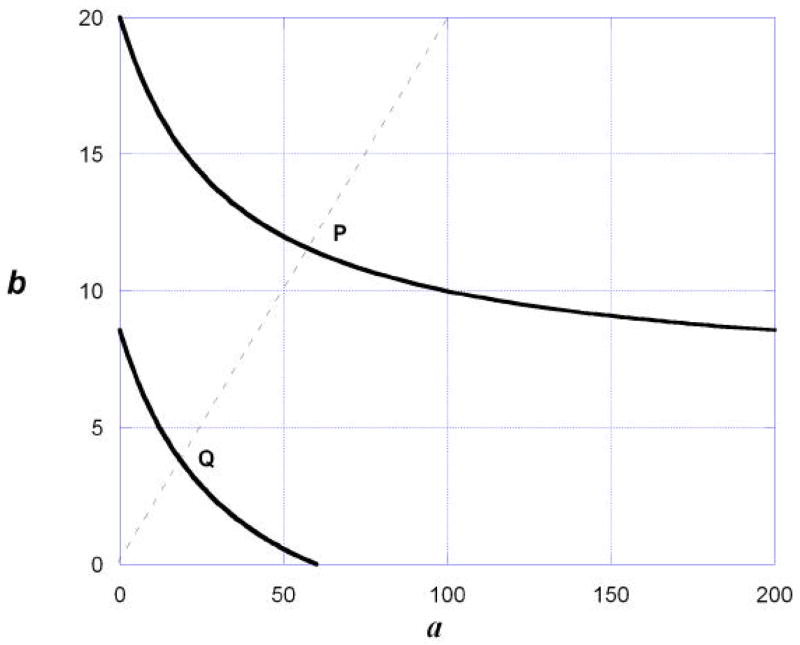
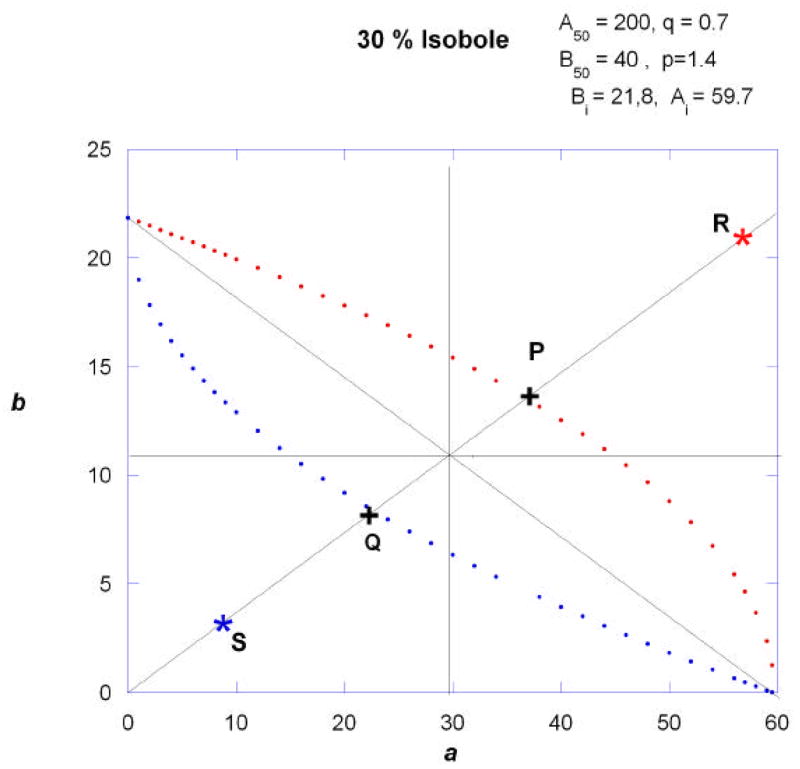
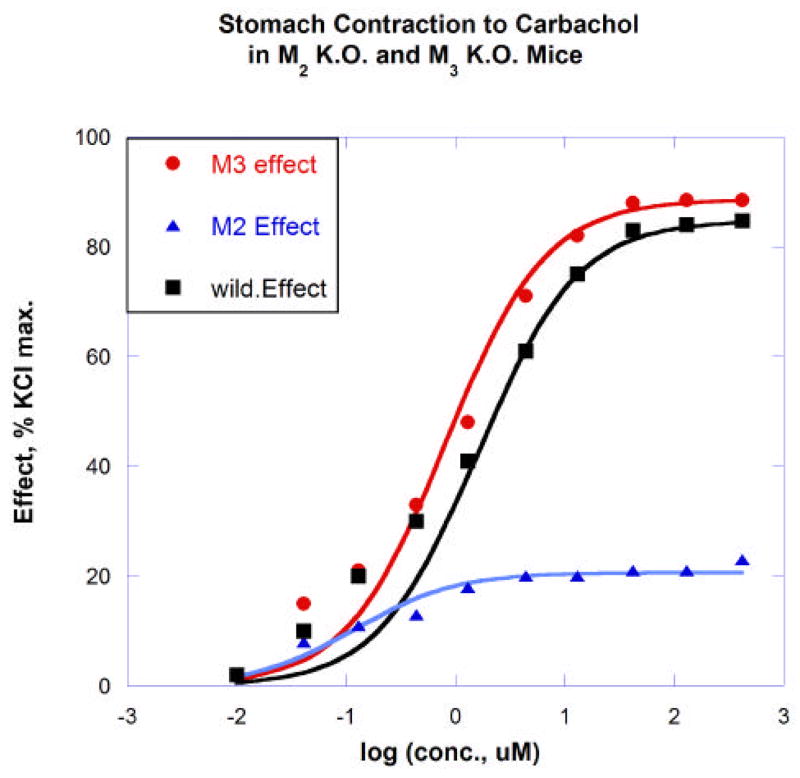
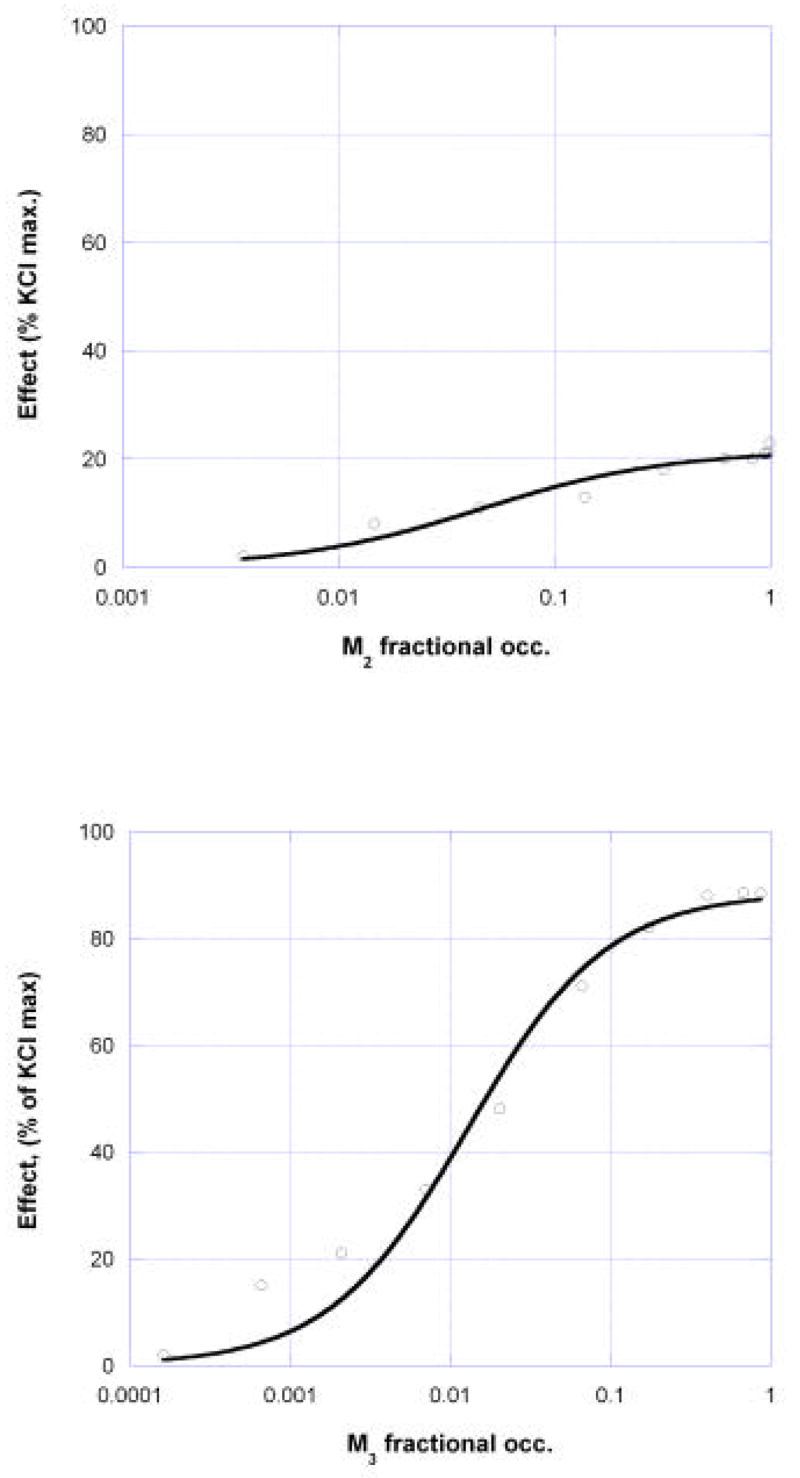
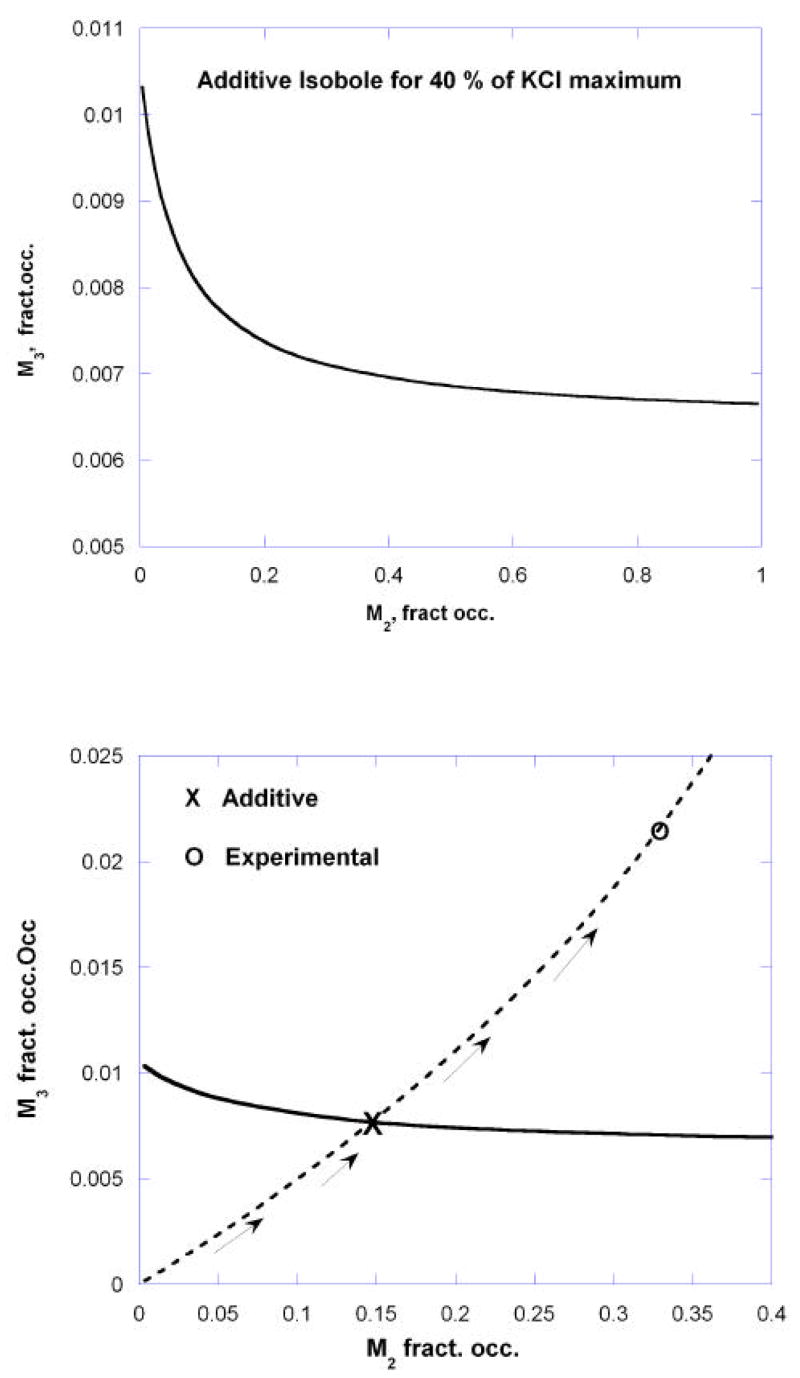
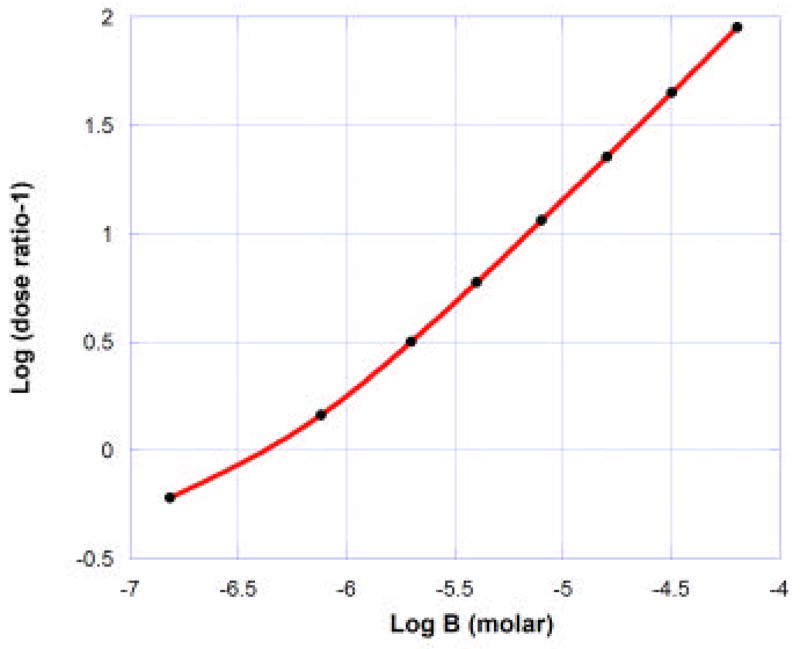
This review has 2 parts. Part I deals with isobolographic procedures that are traditionally applied to the joint action of agonists that individually produce overtly similar effects. Special attention is directed to newer computational procedures that apply to agonists with dissimilar concentration-effect curves. These newer procedures are consistent with the isobolographic methods introduced and used by Loewe, however, the present communications provides the needed graphical and mathematical detail. A major aim is distinguishing super and sub-addictive interactions from those that are simply additive. The detection and measurement of an interaction is an important step in exploring drug mechanism and is also important clinically. Part II discusses a new use of isoboles that is applicable to a single drug or chemical whose effect is mediated by 2 or more receptor subtypes. This application produces a metric that characterizes the interaction between the receptor subtypes. The expansion of traditional isobolographic theory to this multi-receptor situation follows from the newer approaches for 2-drug combination analysis in Part I. This topic leads naturally to a re-examination of competitive antagonism and the classic Schild plot. In particular, it is shown here that the Schild plot in the multi-receptor case is not necessarily linear with unit slope. Both parts of this review emphasize the quantitative aspects rather than the many drugs that have been analyzed with isobolographic methods. The mathematical exposition is rather elementary and is further aided by several graphs. An appendix is included for the reader interested in the mathematical details.


Figures

Fig.1
Fig.1
(upper) Drugs with a constant potency ratio from which ED50 values are determined and plotted as shown in the lower graph in order to anchor the line of additivity. In this illustration a fixed-ratio combination that is additive would be on the line at point (a′,b′) while the experimental point has coordinates (a,b) so that it is below the line of additivity. The ratio of radial distances of point (a,b) to point (a′, b′) is the interaction index.
Fig.2
Fig.2
Illustration of dose equivalence for two drugs whose curves of effect against dose are shown and for which the maximum effects are not necessarily equal. The dose of drug A, denoted a, is found to be equi-effective to a dose of drug B that is denoted beq. That equivalent (beq) + the actual dose b add to give B50 and, hence, the 50% effect. The set of (a,b) values constitute the isobole of additivity which is a straight line only if the potency ratio is constant at all effect levels.
Fig.3
Fig.3
When the two drugs have a constant potency ratio their log(dose)-effect curves are parallel indicating a constant relative potency at every effect level and shown here(left) for four effect levels. For every effect level there is an isobole of additivity and these are linear and parallel (right).
Fig.4
Fig.4
Additive isoboles for two different effect levels as described in the example are illustrated and are based on a full and a partial agonist in combination. The additive isoboles, calculated from Eq. (3), are curved because the relative potency of the two drugs is not constant but varies with the effect level. (See text example.)
Fig.5
Fig.5
Isoboles of additivity for the 30% effect level are shown for two drugs that achieve the same maximum but have a potency ratio that changes with the effect, as indicated by different exponents p and q. In this illustration the 30% effect leads to Ai = 59.6, Bi = 21.8. The curves of additivity, calculated from equations (6) and (7), are symmetric with respect to a point at (Ai/ 2, Bi/ 2), in this case (29.8, 10.9).
Fig. 6
Fig. 6
Dose response curves in mouse isolated stomach muscle for carbachol in wild type and in M2 knockout (M3 effect) and M3 knockout (M2 effect).
Fig.7
Fig.7
Occupancy-effect relations for M2 fractional occupation (from M3 knockouts) and M3 occupation (from M2 knockouts) for carbachol-induced contraction of isolated stomach muscle in mouse.
Fig.8
Fig.8
Isobole for effect = 40% KCl maximum as determined from the fractional occupation of M3 and M2 cholinergic receptors by carbachol in mouse stomach muscle The lower graph, with adjusted scales, shows the occupation path and its direction as the carbachol concentration is increased in the wild type. The experimentally derived point is seen to be clearly above the additive point, thereby indicating a sub-additive interaction when both muscarinic receptors are occupied.
Fig. 9
Fig. 9
(Upper) Occupation-effect curves for the M3 receptor, given by E = 89.8 [M3] / ([M3] + 0.0268), and for the M2 receptor by E = 20.75 [M2] / ([M2] + 0.00404) as described in Example 2. (Lower) shows the additive isobole for the 40% effect and also shows the occupation path (broken line). The experimental occupancy point (O) is seen to be appreciably above the intersection of the curves.
Fig. 10
Fig. 10
Shown is the isobole of additivity for the 40% effect (solid curve) and the carbachol occupation “paths” under two different conditions. The paths indicate the simultaneous carbachol occupation of the M2 and M3 receptor for increasing concentration when it is the sole drug (upper broken curve) and when atropine is present in a fixed concentration = 10 nM (lower broken curve). Point 1 shows the additive occupation pair in the absence of the antagonist, while point 2 is the carbachol additive occupation pair that would restore the effect level when the antagonist is present. This illustration used the atropine mouse smooth muscle dissociation constants 1.26 nM at M2 and 0.316 nM at M3 (Choppin & Eglen, 2001).
Fig. 11
Fig. 11
Illustration of a Schild plot for carbachol with an antagonist having high affinity for the muscarinic M2 receptor in isolated mouse stomach. (See text). Nonlinearity, though slight, is evident. When the points were fitted to a straight line the slope = 0.850 and the pA2 = 6.39.

References

    1. Arunlakshana O, Schild HO. Some quantitative use of drug antagonists. Br J Pharmacol. 1959;14:48–57. - PMC - PubMed
    1. Berenbaum MC. What is synergy? Pharmacol Rev. 1989;41:93–141. - PubMed
    1. Bolan EA, Tallarida RJ, Pasternak GW. Synergy between mu receptor subtypes: Evidence for functional interaction among mu receptor subtypes. J Pharmacol Exp Ther. 2002;303:557–562. - PubMed
    1. Choppin A, Eglen RM. Pharmacological characterization of muscarinic receptors in mouse isolated urinary bladder smooth muscle. Brit J Pharmacol. 2001;133:1035–1040. - PMC - PubMed
    1. DiFazio CA, Brown RE, Ball CG, Heckel CG, Kennedy SS. Additive effects of anesthetics and theories of anesthesia. Anesthesiology. 1972;36:57–63. - PubMed

Substances