. 2006 Nov 1;66(21):10377-83.
doi: 10.1158/0008-5472.CAN-05-3036.

A role for mitochondrial dysfunction in perpetuating radiation-induced genomic instability

Affiliations

A role for mitochondrial dysfunction in perpetuating radiation-induced genomic instability

Grace J Kim et al. Cancer Res. .

Abstract

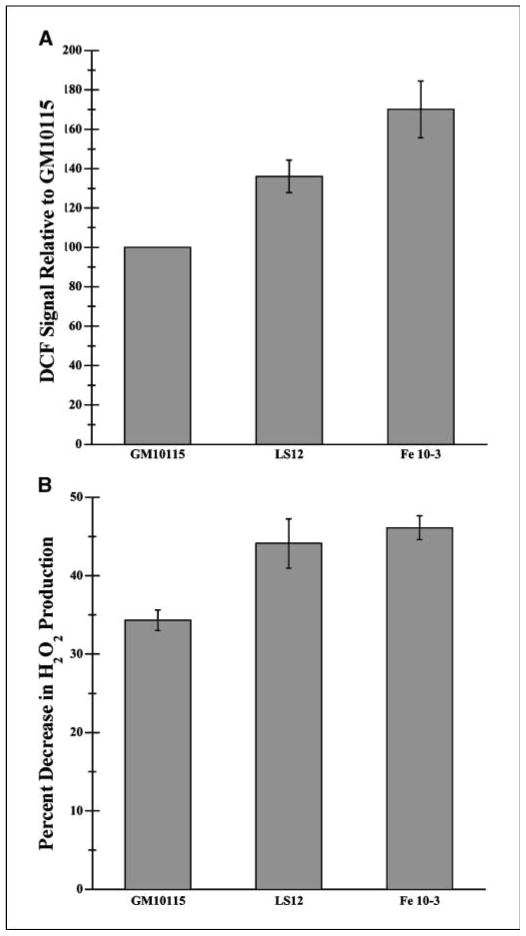
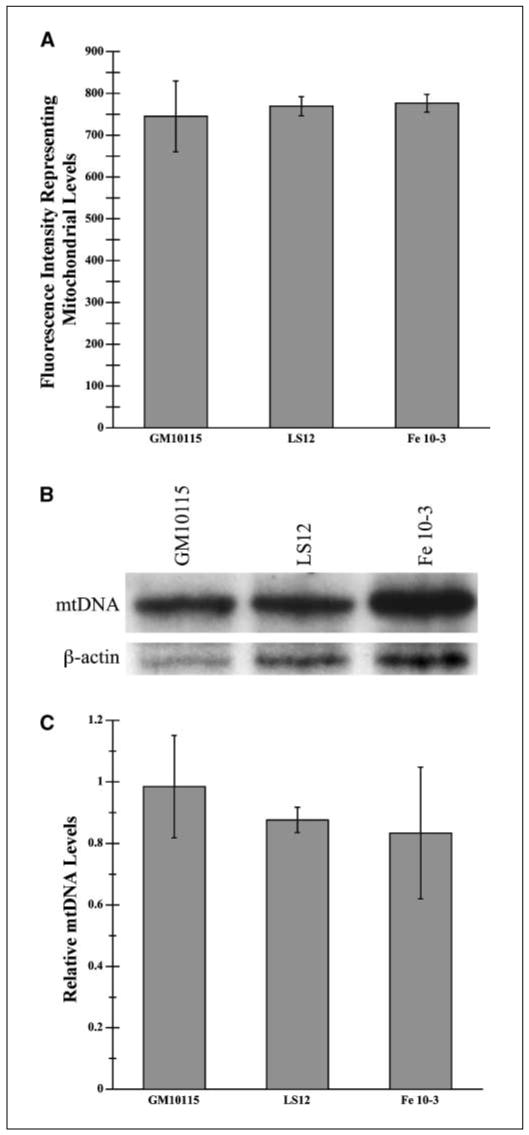
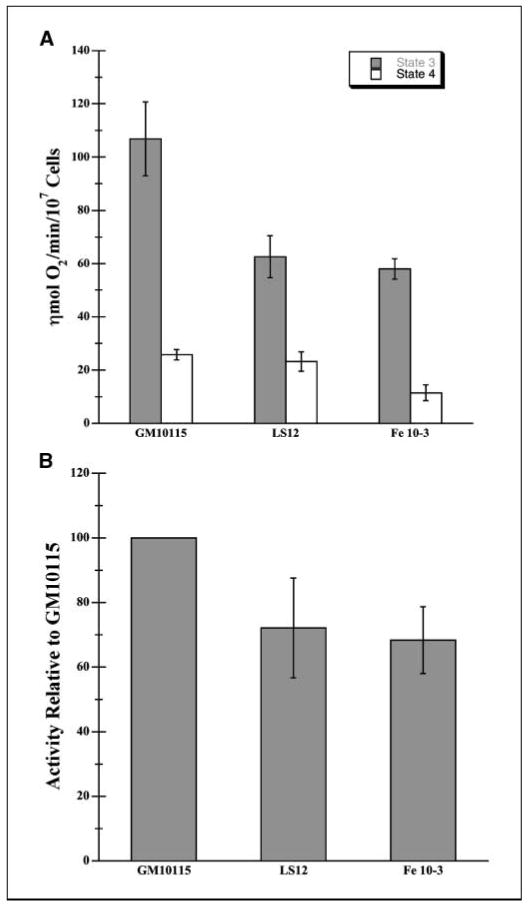
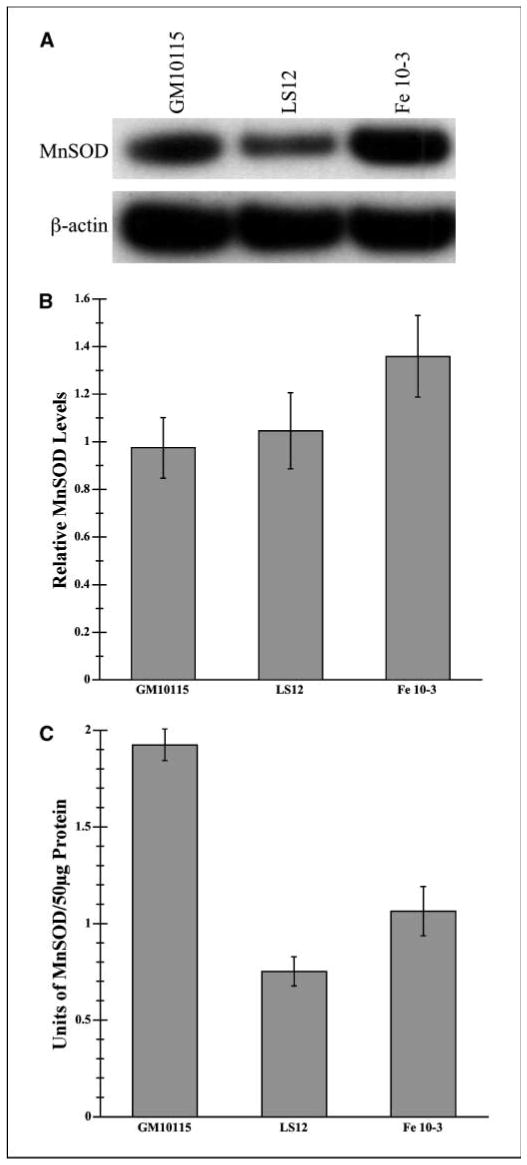
Radiation-induced genomic instability (RIGI) manifests as a heritable increased rate of genetic alterations in the progeny of irradiated cells generations after the initial insult. The progeny can show an increased frequency of chromosomal translocations, deletions, mutations, micronuclei, and decreased plating efficiency. What perpetuates RIGI is unclear; however, persistently increased levels of reactive oxygen species (ROS) are frequently associated with genomically unstable clones. Furthermore, addition of free radical scavengers (e.g., DMSO, glycerol, and cationic thiol cysteamine) reduces the incidence of instability after irradiation, implicating a ROS-mediated role in RIGI induction. Because mitochondria are a major natural cellular source of ROS, we tested the hypothesis that mitochondrial dysfunction has a role in maintaining the elevated ROS levels in our irradiated, genetically unstable GM10115 Chinese hamster ovary cells. Amplex Red fluorometry measurements indicate that the relative contribution of uncoupler-sensitive mitochondrial hydrogen peroxide production to total cellular hydrogen peroxide generation is greater in unstable cells. Measurements of mitochondrial DNA levels and cell cytometric fluorescent measurements of Mitotracker Green FM indicate that differences in mitochondrial ROS production are not due to varying mitochondrial levels. However, mitochondrial respiration measured in digitonin-permeabilized cells is impaired in unstable clones. In addition, manganese superoxide dismutase, a major mitochondrial antioxidant enzyme, exhibits increased immunoreactivity but decreased enzyme activity in unstable clones, which along with decreased respiration rates may explain the increased levels of cellular ROS. These studies show that mitochondria from unstable cells are abnormal and likely contribute to the persistent oxidative stress in the unstable clones.


Figures

Figure 1
Figure 1
ROS present in genetically stable and unstable cells. A, 1 × 10⁶ cells/mL in PBS were incubated with 5 μmol/L DCFDA in DMSO for 30 minutes at 34°C. Fluorescence was analyzed using flow cytometry measuring fluorescence emission at 530 nm with excitation at 490 nm. Propidium iodide staining was used to eliminate dead cells from the analysis. Values represent percentage increase in DCF fluorescence compared with that of stable GM10115 cells. (n = 3; P < 0.001). B, 1 × 10⁷ cells were resuspended in 2 mL sodium buffer (140 mmol/L NaCl, 3 mmol/L KCl, 0.4 mmol/L KH2PO4, 20 mmol/L HEPES, 5 mmol/L NaHCO3, 5 mmol/L glucose, 1 mmol/L MgCl2). Rates of total cellular H2O2 production were measured using the Amplex red dye with 5 units/mL HRP and 40 units/mL SOD. Fluorescence measurements were made at 37°C over 5 minutes at 563 nm excitation and 585 nm emission. After a stable baseline rate was recorded, the respiratory uncoupler FCCP (10 μmol/L) was added to minimize the mitochondrial contribution to cellular H2O2 production. Values represent the percentage reduction in the rate of fluorescence on addition of FCCP (n = 5; P = 0.003).
Figure 2
Figure 2
Relative cellular mitochondrial levels. A, mitochondrial levels were estimated using flow cytometry of cells stained with Mitotracker Green FM, a membrane potential-independent mitochondrial probe. Cells were incubated at 1 × 10⁶ cells/mL in PBS with 250 nmol/L Mitotracker Green FM in DMSO for 30 minutes at 34°C. Fluorescence was analyzed through flow cytometry with excitation and emission at 490 and 516 nm, respectively (n = 3). B, mtDNA was quantified by Southern blotting. Total cellular DNA (20 μg) was cleaved with Kpn1 and fragments were run out on a 0.7% agarose gel and transferred to a nylon membrane. A mix of 32P-labeled labeled cytochrome oxidase subunit 2 (COX2) and subunit 3 (COX3) probes were used to visualize mtDNA. Membranes were washed 2 hours with 2× SSC, 0.1% SDS buffer, 2 hours with 0.1× SSC, 1% SDS buffer, and then 0.1× SSC buffer at 65°C. C, as a control, 32P-labeled actin was hybridized to the membrane overnight and then washed. Levels of mtDNA were quantified using densitometry and normalized with β-actin gene levels (n = 2).
Figure 3
Figure 3
Cellular respiration and cytochrome oxidase activities. A, mitochondrial respiration in situ was measured using a thermostatically controlled Clark oxygen electrode. Cells (1 × 10⁷) were resuspended in 0.5 mL sodium buffer (140 mmol/L NaCl, 3 mmol/L KCl, 0.4 mmol/L KH2PO4, 20 mmol/L HEPES, 5 mmol/L NaHCO3, 5 mmol/L glucose, 1 mmol/L MgCl2) at 37°C. The plasma membrane was selectively permeabilized with 0.03% digitonin in DMSO. Malate (5 mmol/L) and glutamate (5 mmol/L) and ADP (1.6 mmol/L) were added to initiate state 3 respiration. Oligomycin (5 μg/mL), an ATPase synthase inhibitor, was added to initiate state 4 respiration. Columns, mean respiratory rates for state 3 and 4 respiration (n = 4); bars, SE. P < 0.01. B, cytochrome oxidase activity was measured using cells lysed with 0.5% Triton X-100 in 10 mmol/L phosphate (KH2PO4/K2HPO4) buffer containing 20 mmol/L succinate (pH 7.4) at room temperature. Reduced cytochrome c was added to cell lysates containing 30 μg protein in 20 mmol/L phosphate buffer. The rate of cytochrome c oxidation was determined over 2 minutes using a spectrophotometric assay at 550 nm. Values represent activities of unstable cells as a percentage of activity of stable cells. (n = 10; P < 0.001).
Figure 4
Figure 4
Manganese superoxide immunoreactivity and enzyme activity. A, total cellular protein was isolated and Western blotting was done for MnSOD for all three clones. β-Actin was used to normalize values. B, densitometric quantification of MnSOD immunoreactivity present in cell lysates was normalized for each Western immunoblot to β-actin levels (n = 3). C, MnSOD enzyme activity present in 50 μg cell lysate protein was measured by the ability of enzyme to prevent a colorimetric reaction involving nitroblue tetrazolium and superoxide anions generated by an exogenous reaction involving xanthine oxidase. NaCN (5 mmol/L) was added to inhibit CuZnSOD leaving MnSOD activity unaffected. BSA (0.13 mg/mL) and BCS (0.05 mmol/L) were added to eliminate electron transport–generated oxidants. For three independent experiments with three sets of lysates, absorbance changes were measured over 5 minutes at 550 nm. Units of activity were determined through a standard curve. (P < 0.001).

References

    1. Little JB. Radiation carcinogenesis. Carcinogenesis. 2000;21:397–404. - PubMed
    1. Morgan WF. Non-targeted and Delayed effects of exposure to ionizing radiation: I. Radiation-induced genomic instability and bystander effects in vitro. Radiat Res. 2003;159:567–80. - PubMed
    1. Ullrich RL, Ponnaiya B. Radiation-induced instability and its relation to radiation carcinogenesis. Int J Radiat Biol. 1998;74:747–54. - PubMed
    1. Snyder AR, Morgan WF. Radiation-induced chromosomal instability and gene expression profiling: searching for clues to initiation and perpetuation. Mutat Res. 2004;568:89–96. - PubMed
    1. Limoli CL, Corcoran JJ, Milligan JR, Ward JF, Morgan WF. Critical target and dose and dose-rate responses for the induction of chromosomal instability by ionizing radiation. Radiat Res. 1999;151:677–85. - PubMed

Publication types