Comparative Study
. 2006 Nov 1;26(44):11257-66.
doi: 10.1523/JNEUROSCI.2805-06.2006.

Activity-dependent plasticity in the olfactory intrabulbar map

Affiliations
Comparative Study

Activity-dependent plasticity in the olfactory intrabulbar map

Carolyn A Marks et al. J Neurosci. .

Abstract

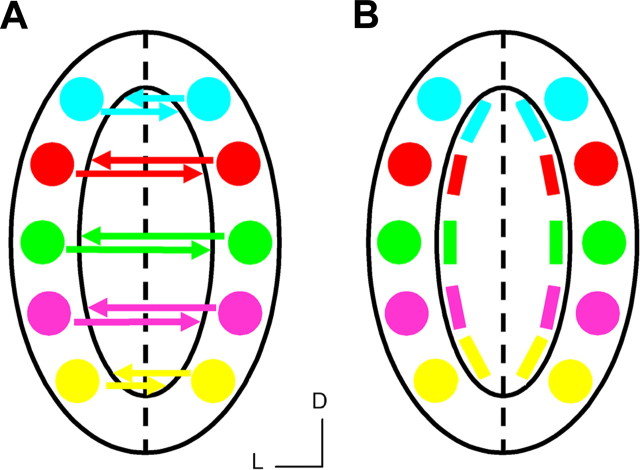
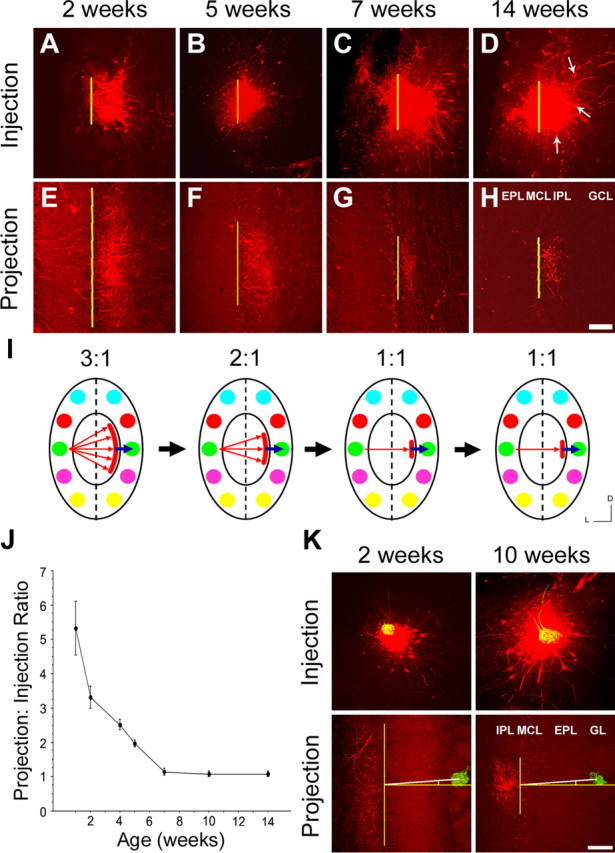
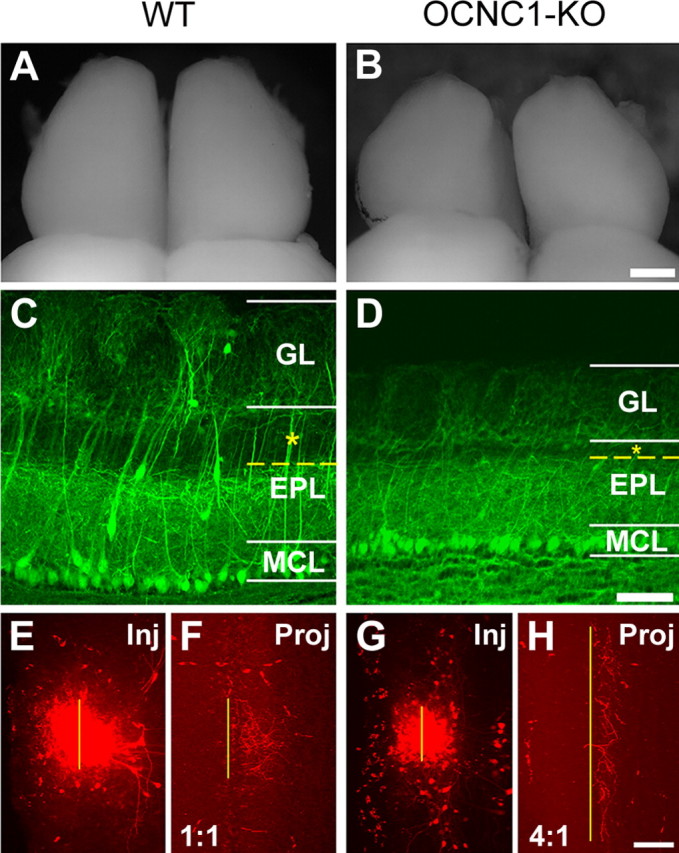
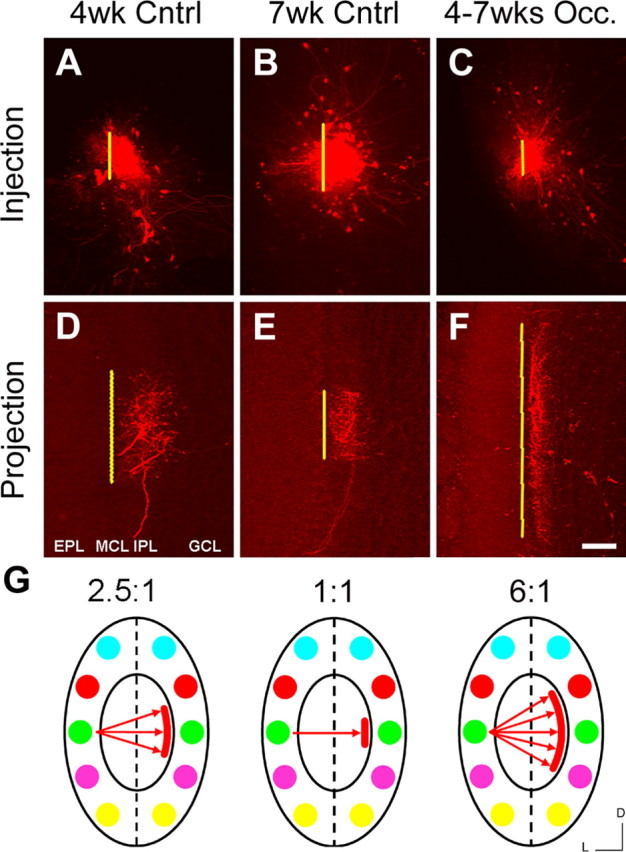
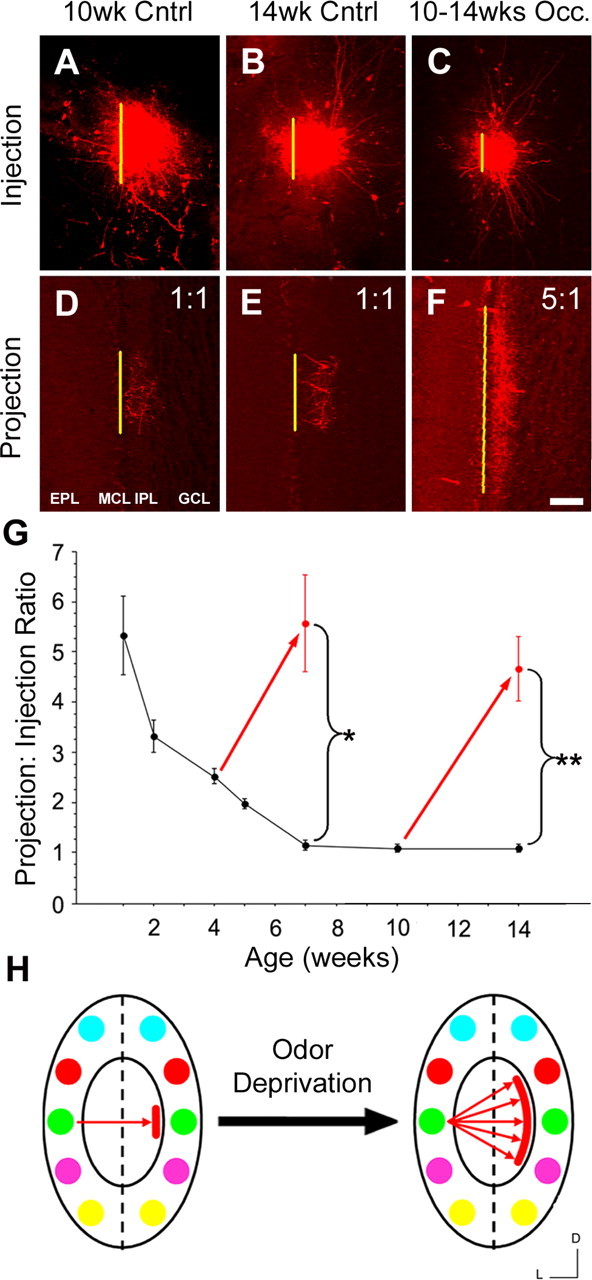
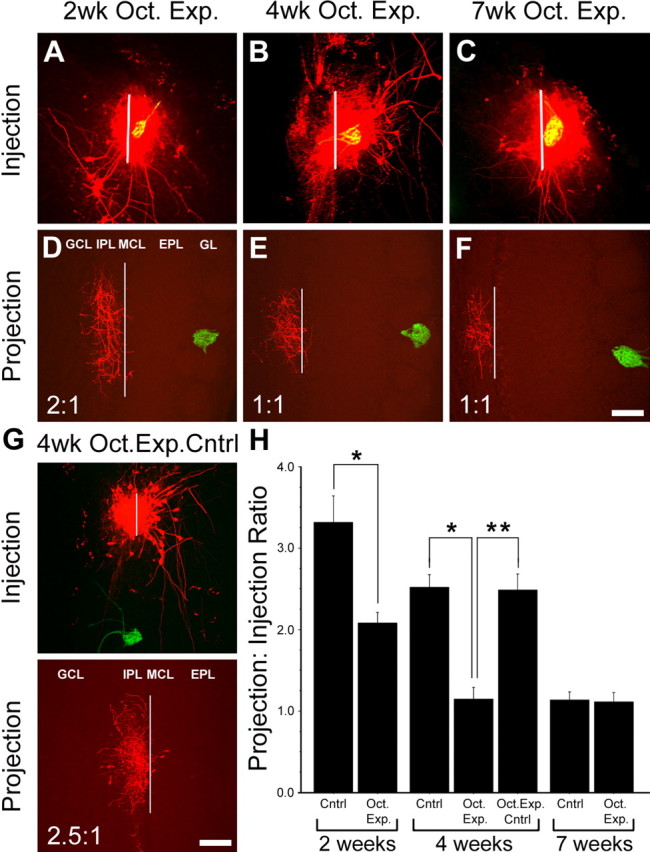
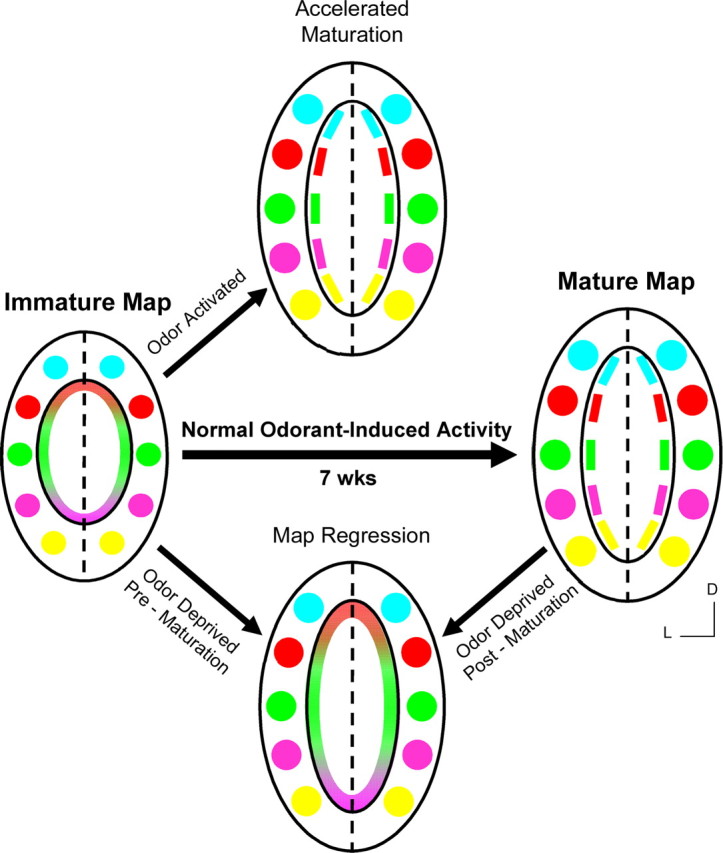
In mammals, each olfactory bulb contains two mirror-symmetric glomerular maps. Isofunctional glomeruli within each bulb are specifically linked through a set of reciprocal intrabulbar projections (IBPs) to form an intrabulbar map. We injected neural tracers into the glomerular layer on one side of the bulb and examined the resulting projection on the opposite side. In adult mice, the size of the projection tuft is directly proportional to the size of the injected region. Using this ratio as a measure of IBP maturity, we find an immature 5:1 projection to injection ratio at 1 week of age that gradually refines to a mature 1:1 by 7 weeks. Moreover, whereas the glomerular map is able to form despite the elimination of odorant-induced activity, the intrabulbar map shows clear activity dependence for its precise formation. Here we show through experiments with both naris-occluded and anosmic mice that odorant-induced activity is not required to establish IBPs but is crucial for projection refinement. In contrast, increased glomerular activation through exposure to distinct odorants during map development can accelerate the refinement of projections associated with the activated glomeruli. These findings illustrate a clear role for odorant-induced activity in shaping the internal circuitry of the bulb. Interestingly, activity deprivation can alter the organization of both the developing and the mature map to the same degree, demonstrating that intrabulbar map plasticity is maintained into adulthood with no discernible critical period.


Figures

Figure 1.
Figure 1.
Olfactory intrabulbar projections and map. A, Schematic representation of the intrabulbar pathway connecting isofunctional glomeruli in the two halves of the bulb. The large oval represents a single olfactory bulb, and the dashed lined is the line of symmetry separating the two mirror-symmetric glomerular maps. Colored spheres represent glomeruli receiving input from different odorant receptors, and colored arrows depict the intrabulbar projections that reciprocally link isofunctional glomeruli. B, Schematic representation of the intrabulbar map that is generated as axon terminals from external tufted cells ramify into tufts as illustrated by colored bars. The resulting intrabulbar map mirrors the glomerular map at its surface. D, Dorsal; L, lateral.
Figure 2.
Figure 2.
Developmental refinement of the intrabulbar map and projection specificity. A–D, Horizontal tangential sections through the glomerular layer show tracer injections in the lateral olfactory bulb of wild-type mice at four time points during postnatal development (yellow lines represent diameter measurements, and white arrows show external tufted cells). E–H, Corresponding intrabulbar projection sites from A–D, respectively, demonstrating developmental refinement. Scale bar, 100 μm. I, Schematic depicting the developmental profile of the intrabulbar projections in E–H, illustrating the initial broad distribution of axon terminals and their refinement to a specific glomerular locus as indicated by blue arrows. Ratios compare diameters of projection tuft with injection site. J, Graph illustrating the progression of intrabulbar projections from an immature state, with a 5:1 ratio (5.3 ± 0.8; mean ± SD; n = 5) at 1 week of age, to full maturity by 7 weeks with a 1:1 ratio (1.1 ± 0.1; mean ± SD; n = 7), and maintenance of this ratio into adulthood. Error bars represent ± SD. K, Top panels show tracer injections performed on rI7→M71 mice targeting the lateral glomerulus at 2 and 10 weeks of age. Bottom panels show corresponding projections sites illustrating the center point of each projection with respect to the isofunctional glomerulus. Vertical yellow lines mark the size of the projection tuft. Horizontal yellow lines extend perpendicular from the midpoint of each projection. White lines mark the degree off center of the isofunctional rI7→M71 glomerulus. GL, Glomerular layer; MCL, mitral cell layer; GCL, granule cell layer. Scale bar, 100 μm. D, Dorsal; L, lateral.
Figure 3.
Figure 3.
Activity-independent formation of intrabulbar projections. Comparison of olfactory bulbs from 7-week-old wild-type and OCNC1-KO mice. Whole-mount view of the dorsal surface of the olfactory bulbs from wild-type (A) and OCNC1-KO (B) mice showing the reduced size of the bulbs in OCNC1-KO mice. Scale bar, 400 μm. Histological sections from a transgenic mouse containing YFP-labeled mitral cells (YFP-G, a marker line for mitral cells; C) and a YFP-G mouse in an OCNC1-KO background (YFP-G/OCNC1-KO; D), highlighting the compression of olfactory bulb layers typical of OCNC1-KO mice and demonstrating the dramatic reduction in the superficial EPL layer (asterisk) in which ETCs are typically located. GL, Glomerular layer; MCL, mitral cell layer. Scale bar, 100 μm. Injection (Inj) and projection (Proj) sites from 7-week-old wild-type (E, F) and OCNC1-KO (G, H) mice demonstrate that intrabulbar projections are present in OCNC1-KO mice (H) but are not refined compared with wild-type mice (F). Scale bar, 100 μm.
Figure 4.
Figure 4.
Activity-dependent refinement of the intrabulbar map. Comparing the effect of odorant deprivation on intrabulbar map development with control mice. A–C, Olfactory bulb tracer injections performed on 7-week-old mice occluded (Occ.) from PNW-4 to PNW-7 (C) compared with 4-week-old (A) and 7-week-old (B) controls (Cntrl). D–F, Corresponding intrabulbar projection sites from A–C, respectively, reveal a clear broadening of projections in the occluded mice compared with controls, demonstrating plasticity during intrabulbar map maturation. MCL, Mitral cell layer; GCL, granule cell layer. Scale bar, 100 μm. G, Schematics depicting the maturation state of the map based on projection to injection ratios showing a partially refined mean ratio of 2.5:1 at 4 weeks (left schematic) corresponding to the initiation of the naris occlusion period, a fully refined map (middle schematic) showing a 1:1 ratio at 7 weeks, and an altered map (right schematic) after activity deprivation with a 6:1 ratio reminiscent of a completely immature map. D, Dorsal; L, lateral.
Figure 5.
Figure 5.
Activity is required to maintain the intrabulbar map. Testing the effect of odorant-deprivation on the mature map. A–C, Olfactory bulb tracer injections performed on olfactory bulbs of mature mice at 10 weeks (A) and 14 weeks (B) of age and animals occluded (Occ.) from PNW-10 to PNW-14 (C). D–F, Projection sites corresponding to A–C, respectively, indicate a clear broadening of projections in the occluded mice (F) compared with projections from either control mice (D, E), demonstrating intrabulbar map plasticity after maturity. MCL, Mitral cell layer; GCL, granule cell layer. Scale bar, 100 μm. G, Graph showing the effect of odorant deprivation on the development and maintenance of the intrabulbar map. Red arrows represent the effect of naris occlusion in two experimental groups: mice blocked from PNW-4 to PNW-7 (5.9 ± 1.1; n = 5) and PNW-10 to PNW-14 (4.7 ± 0.6; n = 4). Error bars represent ± SD. Graph illustrates that both groups show a significant increase in their average projection to injection ratio (*p < 0.001, t = 24.89; **p < 0.001, t = 33.48), demonstrating clear activity-dependent plasticity with no critical period. H, Schematic shows that blocking odorant-induced activity results in dramatic broadening of the projection site regardless of the initial maturation state of the map when odorant deprivation begins. D, Dorsal; L, lateral.
Figure 6.
Figure 6.
Odorant-induced activity accelerates intrabulbar map refinement in a spatially specific manner. Olfactory bulbs of rI7→M71 mice exposed to octanal (Oct. Exp.) from birth until injections targeting the rI7→M71glomeruli were performed at 2 weeks (A), 4 weeks (B), and 7 weeks (C) of age. D–F, Corresponding intrabulbar projection sites from A–C, respectively, centered beneath isofunctional glomeruli demonstrating accelerated developmental refinement of the intrabulbar projections (white lines represents diameter measurements). Scale bar, 100 μm. G, Tracer injection in 4-week-old rI7→M71 mice exposed to octanal (4wk Oct. Exp. Cntrl) targeting a region of the bulb not activated by octanal produces a projection to injection ratio similar to non-odorant-exposed control mice at 4 weeks of age. GL, Glomerular layer; MCL, mitral cell layer; GCL, granule cell layer. Scale bar, 100 μm. H, Bar graph comparing the mean projection to injection ratios of octanal-exposed mice at 2 weeks (2.1 ± 0.1; n = 5), 4 weeks (1.1 ± 0.1; n = 7), and 7 weeks (1.1 ± 0.1; n = 7) to age-matched controls (2 weeks, 3.3 ± 0.3, n = 4; 4 weeks, 2.5 ± 0.2, n = 6; and 7 weeks, 1.1 ± 0.1, n = 7), revealing significant differences at 2 weeks (*p < 0.001; t = 7.83) and 4 weeks (*p < 0.001; t = 16.24) of age but not at 7 weeks (p = 0.650; t = 0.47), demonstrating that odorant-induced activity can accelerate maturation of the intrabulbar map to full maturity by 4 weeks of age. By comparison, ratio measurements in 4-week-old odorant-exposed mice in which tracers were targeted to bulb regions not activated by octanal (Oct. Exp. Cntrl) were indistinguishable from age-matched non-odorant-exposed mice (Cntrl) but significantly different from 4-week-old odorant-exposed mice targeting the rI7→M71 glomerulus (**p < 0.001; t = 13.73), suggesting that accelerated maturation is specific to odorant-activated regions. Error bars represent ± SD.
Figure 7.
Figure 7.
External tufted cell density is unaltered by activity deprivation in mature mice. A, Coronal section of a mouse olfactory bulb immunohistochemically stained for CCK. This reveals neuropeptide expression in intrabulbar projections (arrowheads) located in the IPL. Low levels of CCK neuropeptide are also detectible in scattered cells located in the EPL and mitral cell layer (MCL). GL, Glomerular layer. Scale bar, 100 μm. B, Higher magnification of boxed region in A shows CCK expression in ETCs (arrows). Scale bar, 100 μm. C, In situ hybridization for CCK mRNA shows equal distribution of CCK-positive cells throughout the bulb. Scale bar, 400 μm. Higher-magnification views of dorsal (D) and medial (H) boxed regions in C show similar ETC density. Scale bar, 100 μm. E–H, CCK mRNA in situ images of the medial olfactory bulb at 1, 4, 7, and 14 weeks of age, respectively. Scale bar, 100 μm. I, Graph showing the average density of ETCs within the bulb during its development, demonstrating a clear increase in ETCs from PNW-1 to PNW-7 coinciding with the development of the intrabulbar map. Error bars represent ± SEM. K, CCK mRNA expression in the medial olfactory bulb of a 14-week-old mouse after naris occlusion from week 10 to 14 shows a noticeable decrease in CCK mRNA levels compared with 14 week wild type, suggesting that CCK expression may be activity dependent. Scale bar, 100 μm. J, Graph comparing the average ETC density in mice occluded from PNW-10 to PNW-14 to wild-type controls at 7 and 14 weeks of age (n = 4 each) showing no significant difference. Error bars represent ± SEM.
Figure 8.
Figure 8.
Activity-dependent plasticity in the intrabulbar map. The immature intrabulbar map links isofunctional regions between the two hemispheres of an olfactory bulb, with broadly targeted intrabulbar projections depicted by similarly colored regions in the schematics. As the projections mature during the first 7 postnatal weeks, they refine to target specific isofunctional odor columns centered beneath isofunctional pairs of glomeruli producing a mature and fully refined intrabulbar map. Reduced odorant-induced activity resulting from odor deprivation, either during map refinement (Pre-maturation) or after map refinement (Post-maturation), produces a dramatic expansion of intrabulbar projections or regression of the intrabulbar map to an immature-like state. Conversely, enhanced activity through odorant exposure during map maturation results in accelerated refinement of projections associated with the activated regions. D, Dorsal; L, lateral.

References

    1. Altman J. Autoradiographic and histological studies of postnatal neurogenesis. IV. Cell proliferation and migration in the anterior forebrain, with special reference to persisting neurogenesis in the olfactory bulb. J Comp Neurol. 1969;137:433–457. - PubMed
    1. Baker H, Cummings DM, Munger SD, Margolis JW, Franzen L, Reed RR, Margolis FL. Targeted deletion of a cyclic nucleotide-gated channel subunit (OCNC1): biochemical and morphological consequences in adult mice. J Neurosci. 1999;19:9313–9321. - PMC - PubMed
    1. Belluscio L, Katz LC. Symmetry, stereotypy, and topography of odorant representations in mouse olfactory bulbs. J Neurosci. 2001;21:2113–2122. - PMC - PubMed
    1. Belluscio L, Gold GH, Nemes A, Axel R. Mice deficient in G(olf) are anosmic. Neuron. 1998;20:69–81. - PubMed
    1. Belluscio L, Lodovichi C, Feinstein P, Mombaerts P, Katz LC. Odorant receptors instruct functional circuitry in the mouse olfactory bulb. Nature. 2002;419:296–300. - PubMed

Publication types

LinkOut - more resources