Comparative Study
. 2006 Nov 1;26(44):11313-23.
doi: 10.1523/JNEUROSCI.2157-06.2006.

Modulation of dorsolateral prefrontal delay activity during self-organized behavior

Affiliations
Comparative Study

Modulation of dorsolateral prefrontal delay activity during self-organized behavior

Emmanuel Procyk et al. J Neurosci. .

Abstract

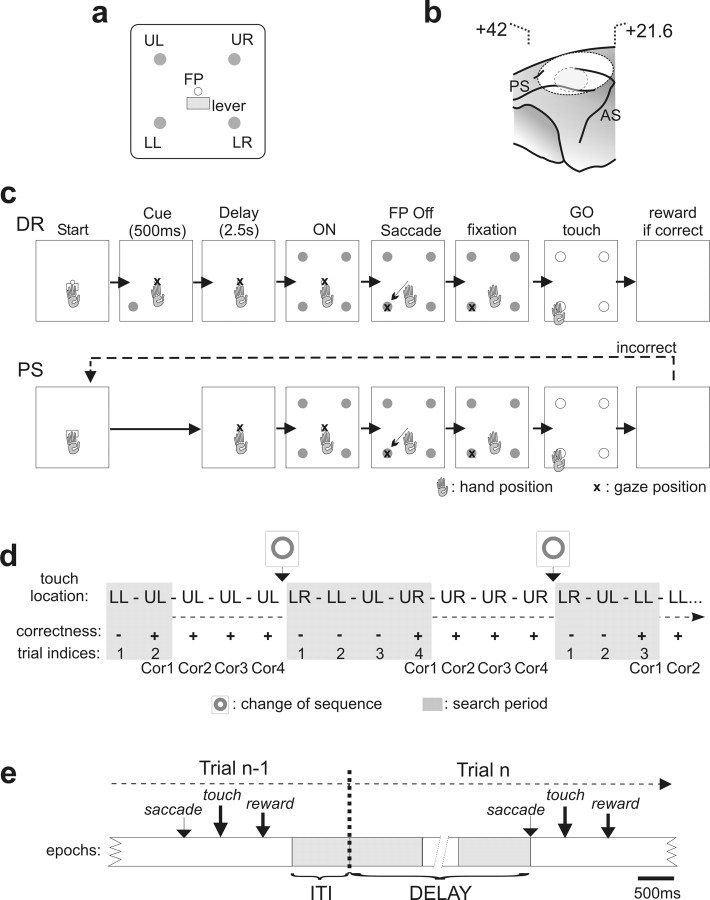
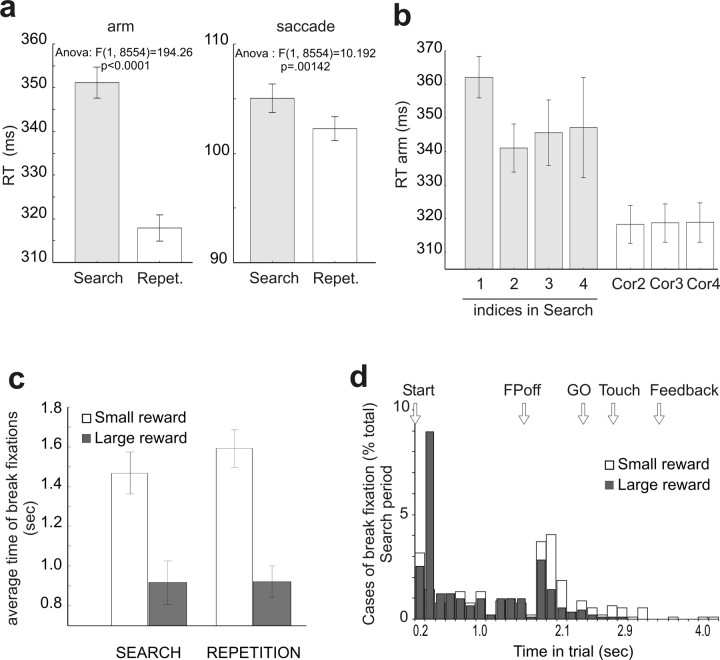
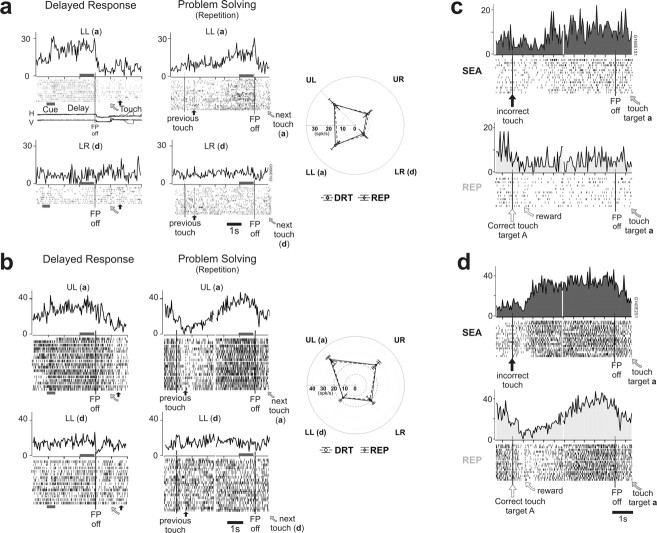
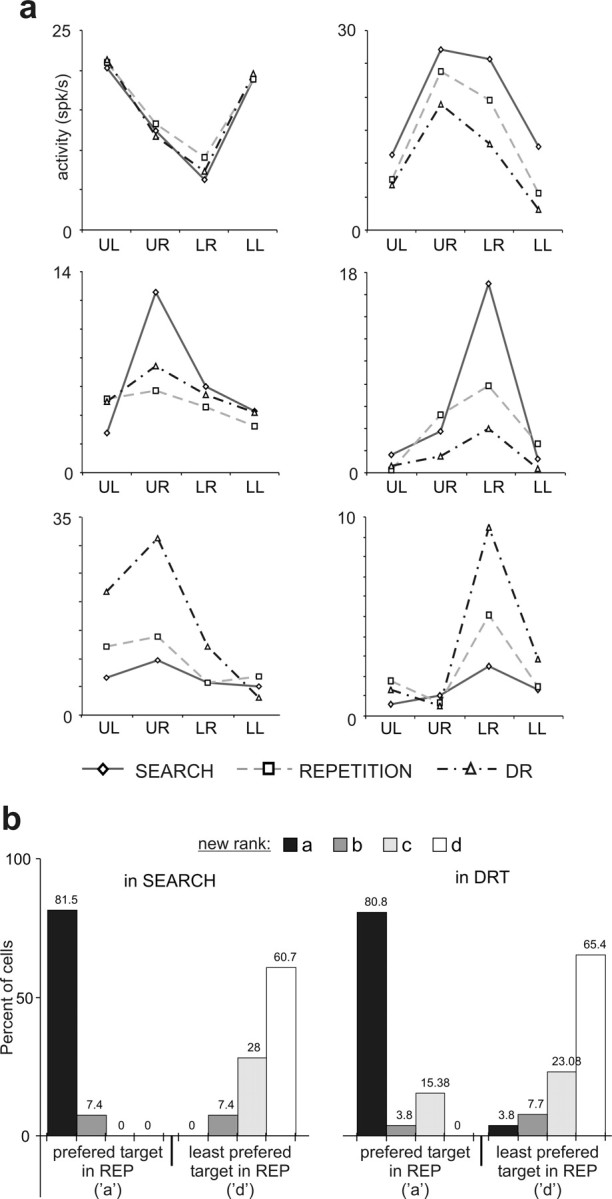
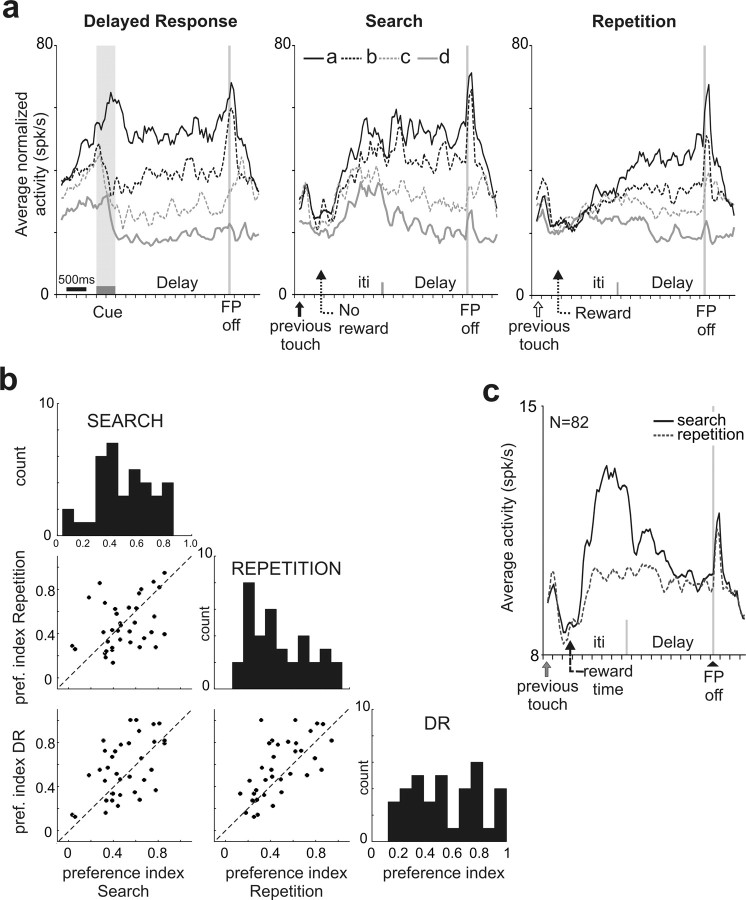
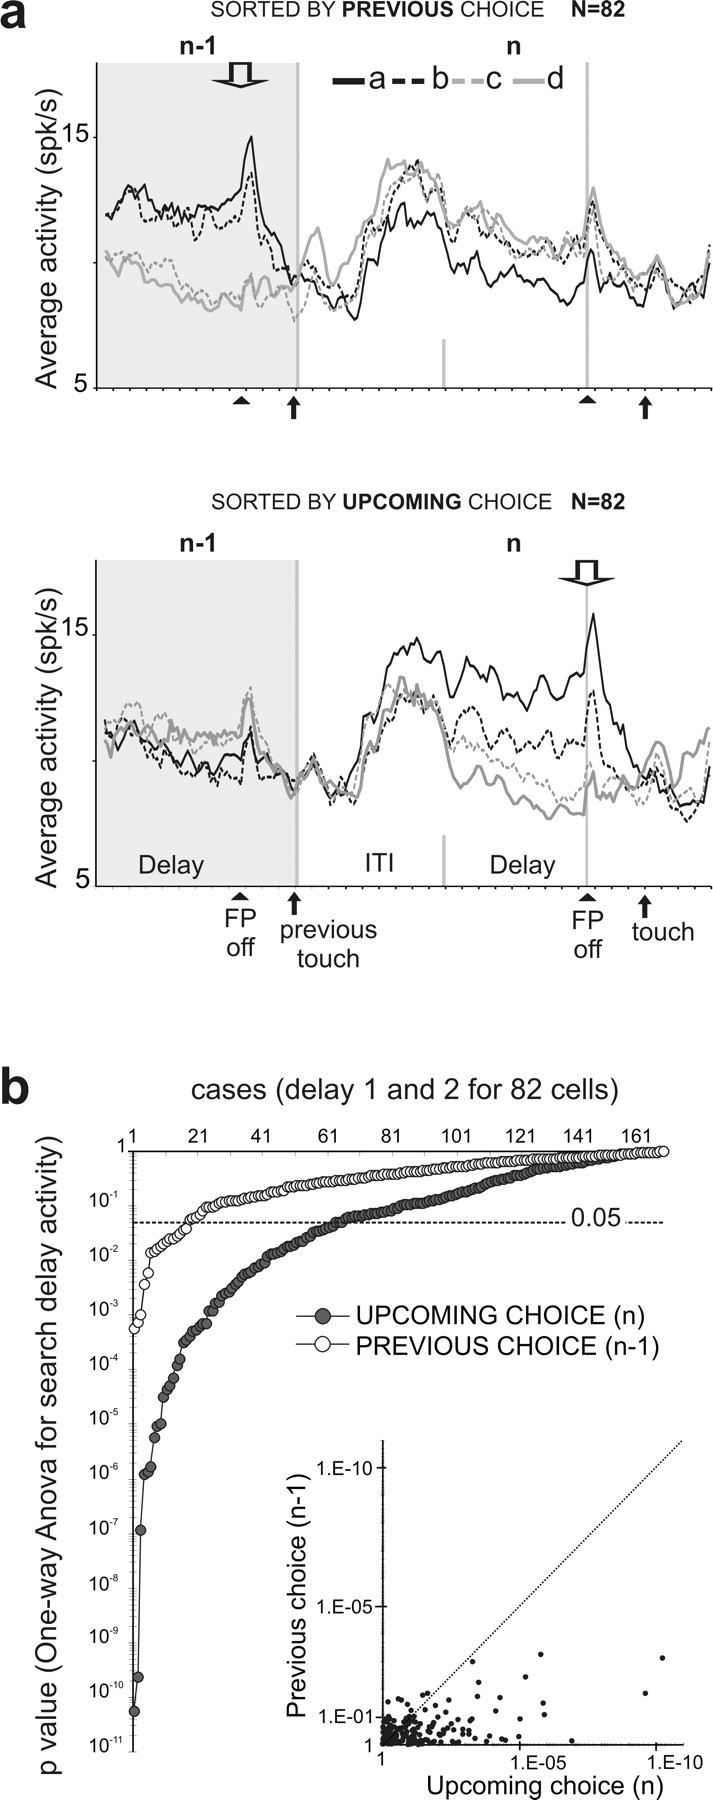
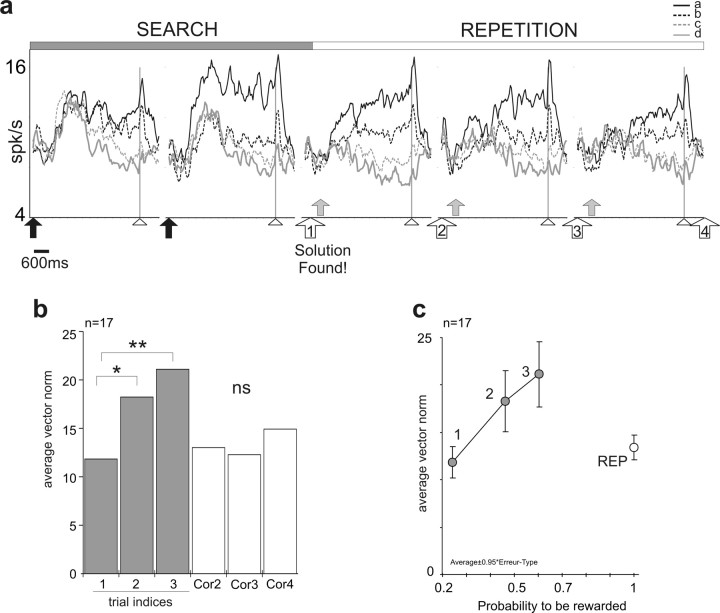
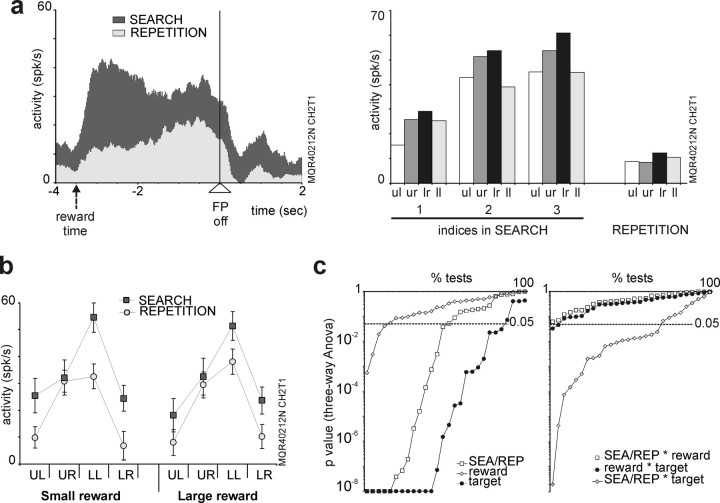
The regulation of cognitive activity relies on the flexibility of prefrontal cortex functions. To study this mechanism we compared monkey dorsolateral prefrontal activity in two different spatial cognitive tasks: a delayed response task and a self-organized problem-solving task. The latter included two periods, a search by trial and error for a correct response, and a repetition of the response once discovered. We show that (1) delay activity involved in the delayed task also participates in self-generated responses during the problem-solving task and keeps the same location preference, and (2) the amplitude of firing and the strength of spatial selectivity vary with task requirement, even within search periods while approaching the correct response. This variation is dissociated from pure reward probability, but may have a link with uncertainty because the selectivity dropped when reward predictability was maximal. Overall, we show that spatially tuned delay activity of prefrontal neurons reflects the varying level of engagement in control between different spatial cognitive tasks and during self-organized behavior.


Figures

Figure 1.
Figure 1.
Display, trial structures in DR and PS tasks, task-related intervals, and location of recordings. a, Location of stimuli on the display monitor. Four target items (disks of 5 mm in diameter) were used: upper left (UL), upper right (UR), lower right (LR), lower left (LL). A central white disk served as the FP. The lever was disposed just below the FP. b, Location of the recording chamber (outer circle) and of the area of recordings (inner dotted circle) based on the presurgery magnetic resonance imaging of the animal. Stereotaxic coordinates of the anterior and posterior limits of the chamber are shown. c, Diagram of trial events for the DR and PS tasks. In the DR, the animal had to start the trial by touching the lever and holding his touch. The FP appeared and the animal had to fixate it with his gaze. A cue appeared at one of the four locations. A delay period followed, and ended by the simultaneous onset of the four targets. At the FP offset, the animal made a saccade toward a target, fixated it, and then touched it after the go signal. A reward was delivered for choosing the correct target. The structure of a trial in the PS task was similar except that there was no cue. The animal had to search for the correct target by trial and error. If a choice in one trial was incorrect, the monkey could select another target in the following trial and so on until the solution was discovered (search period). Each touch was followed by an interval of 2000 ms. d, Example of a chronological list of trials during the PS task. In the first problem, the monkey discovered the solution (UL) in two trials. Then he repeated the correct response three times (repetition period). The different types of trials are indicated below (−, incorrect; +, correct). e, Schematic representation of two successive trials (n − 1 and n) in the PS task, and of the epochs used for analysis: ITI, delay, early plus late; see Materials and Methods). The time interval between one touch and the saccade in the next trial was the focus of our study, and was used to represent neural activity in Figures 3 and 5–8.
Figure 2.
Figure 2.
Behavioral data from the third animal performing the PS task with reward size variation. a, Reaction times (RTs) for arm movements and saccades during search and repetition periods of the PS task. b, RT for arm movements in the successive trials of search and repetition periods. c, d, Break of fixation errors for the large and small reward conditions. The animal is making breaks of fixation later in the course of a trial during search than during repetition (c). For the large reward trials, the breaks are done in majority at the initiation of the trial whereas they occur more often at the time of saccade toward the target for the small reward trials (d). Error bars indicate SE.
Figure 3.
Figure 3.
Examples of delay activity in the different tasks. a, b, Two delay cells in the DR and PS tasks. Raster and histograms show responses of a single neuron for the preferred (a) and least preferred (d) targets in the DR and PS (repetition trials only) tasks. The activity is aligned on the FP offset in DR trials, and on the previous touch time and on the FP offset in PS trials. A sample of eye-movement recordings are presented for DR trials (H and V). A gray horizontal bar below the rasters underlines the cue period in the DR task. Time of target touch and reward delivery are indicated by tick marks in rasters and a curved arrow and a black upward arrow below rasters, respectively. The polar graphs represent the average activity measured in late delay (indicated by a gray horizontal bar below histograms) (Fig. 1) (see Materials and Methods) for the four targets during the DR and PS tasks (dashed and plain lines, respectively). For both cells, the spatial selectivity was identical in the two tasks. c, d, Comparison between search and repetition trials for two delay neurons (a and b) recorded during the PS task. The figure presents the activity between two successive choices when the second one was on target (a) (best target). Trials from the search and repetition periods are separated and noted SEA and REP, respectively. c, The neuron expressed tonic activity during the search period. This activity disappeared during repetition periods. d, For this cell, the activity increased within 300 ms after the time at which the reward would have occurred in a correct trial and stayed tonic until the next response (touch target a). In repetition trials, this short latency response disappeared.
Figure 4.
Figure 4.
Conservation of spatial preference. a, Influence of task period on six delay cells. Each plot presents the average delay activity for one cell and for the four target locations [upper left (UL); upper right (UR); lower right (LR); lower left (LL)] in the three periods (search, repetition, and DR). Two-way ANOVA; top left: target location, p < 10–7; period, not significant (ns); interaction, ns; top right: target, p < 10–5; period, p < 0.006; interaction, ns; middle raw: target, p < 10–7; period, p < 0.05; interaction, p < 0.002; lower raw: target, p < 10–7; period, p < 0.005; interaction, p < 0.005. b, Histogram showing the proportion of cells for which activity for target a and d in repetition (REP) could be reclassified as a, b, c, or d in the search and DR task (from 26 cells). Eighty percent of cells kept their preferred target a in the search and DR tasks.
Figure 5.
Figure 5.
Population activity in DR and PS tasks. a, The activity of 36 cells recorded during both DR and PS tasks was normalized and averaged (see Materials and Methods). Note that the spatial selectivity stays identical from one task to another although changes in amplitude occurred between search and repetition. In the DR task, the spatial selectivity observed in anticipation of the cue onset is a consequence of trial blocking used in the first few recording sessions (see Materials and Methods). b, The preference index is plotted for the 36 cells recorded in PS task and DR task, and for the three periods: search, repetition, and DR. Correlation coefficients: repetition (REP) versus search (SEA): r2 = 0.1261; r = 0.3551; p = 0.0336; SEA versus DR: r2 = 0.2797; r = 0.5288; p = 0.0009; REP versus DR: r2 = 0.4251; r = 0.6520; p = 0.00002.) c, The grand average activity for all targets and all cells during search and repetition shows the main difference at the end of trial and at the beginning of the delay period, but not at the time of saccade.
Figure 6.
Figure 6.
Space coding during search trials. a, Each graph shows the population activity for an average trial n (in the white area) and the average delay activity of the previous trials (n − 1) (in the gray area). The top diagram shows averages calculated by sorting trials according to the position of the target (a, b, c, or d) selected in the previous trials (n − 1) (downward arrow). In the bottom diagram, trials were sorted according to the upcoming choice, in n. Black upward arrows indicate events (target touch and FP off). Note that the spatial selectivity appears only when activity is sorted according to the choice made at the end of the delay, and not when it is sorted according to the previous choice. b, The p values obtained when influence of target location was tested for trials sorted according to previous choice or upcoming choice. The ANOVA has been run for each cell and for early and late delays separately. In ordinate, the p values are on a logarithmic scale. The horizontal red line shows the statistical threshold at p = 0.05. The inset shows the two p values plotted against each other for each delay.
Figure 7.
Figure 7.
Modulation of selectivity during the PS task. a, Evolution of activity for the entire population of 82 cells. Graphs present the average activity for different succession of trials during an average problem. Black arrows indicate incorrect touches, arrowheads indicate FP offset, white numbered arrows indicate the successive correct touches during repetition, and red arrows indicate reward deliveries. The first reward signifies discovery of the correct response. Note that the activity at the end of trials and during the delay, as well as the strength of spatial selectivity, changes during the search and then along the repetition period. The highest discrimination for the best target is seen just before the discovery. Effect of trials on activity in early delay: one-way ANOVA, target a, F = 4.49, p < 0.002; b, F = 4.003, p < 0.004; c, F = 1.26, not significant (ns); d, F = 1.19, ns. b, Average vector norm calculated for 17 delay cells along search and repetition periods. See the significant increase in vector norm in search and decrease in repetition (linear mixed-effects model; *p = 0.0194; **p = 0.0009). c, Plot of average vector norms for 17 cells against the probability to be rewarded. The probabilities are estimated from behavioral data (see Materials and Methods and Results). The numbers 1, 2, and 3 label data for trials indices 1, 2, and 3, respectively. Error bars indicate SE.
Figure 8.
Figure 8.
Reward size effect compared with space and task period effect. a, b, Data from one delay activity recorded in the third monkey. The average firing rate in search and repetition, all targets together, from the time of feedback to the next target selection is represented in a on the left. On the right, data for the different trial types showing the change in activity for that cell during search and between search and repetition [fixation point offset (FP off)]. b, The average discharge in early delay for the four targets, the two periods of the PS task, and the two reward sizes. c, The probability obtained from statistical testing (ANOVA) of the relative effects of period [search (SEA), repetition (REP)], reward size, and target position on the average activity measured in ITI, early and late delays. On the right, the p values correspond to interaction effects. The gray horizontal line marks the selected threshold for statistical significance (p = 0.05). Note that period (search/repetition) and target position have the major influence on neural activity. Error bars indicate SE.

Comment in

References

    1. Amemori K, Sawaguchi T. Contrasting effects of reward expectation on sensory and motor memories in primate prefrontal neurons. Cereb Cortex. 2006;16:1002–1015. - PubMed
    1. Amiez C, Joseph JP, Procyk E. Anterior cingulate error-related activity is modulated by predicted reward. Eur J Neurosci. 2005;21:3447–3452. - PMC - PubMed
    1. Baddeley AD. New York: Oxford UP; 1986. Working memory.
    1. Barkley RA. Linkages between attention and executive functions. In: Reid Lyon G, Krasnegor NA., editors. Attention, memory and executive function. Baltimore: P. H. Brooks; 2001. pp. 307–326.
    1. Barone P, Joseph JP. Prefrontal cortex and spatial sequencing in macaque monkey. Exp Brain Res. 1989;78:447–464. - PubMed

Publication types

LinkOut - more resources