Comparative Study
. 2006 Nov 1;26(44):11387-96.
doi: 10.1523/JNEUROSCI.3349-06.2006.

Increased citrullination of histone H3 in multiple sclerosis brain and animal models of demyelination: a role for tumor necrosis factor-induced peptidylarginine deiminase 4 translocation

Affiliations
Comparative Study

Increased citrullination of histone H3 in multiple sclerosis brain and animal models of demyelination: a role for tumor necrosis factor-induced peptidylarginine deiminase 4 translocation

Fabrizio G Mastronardi et al. J Neurosci. .

Abstract

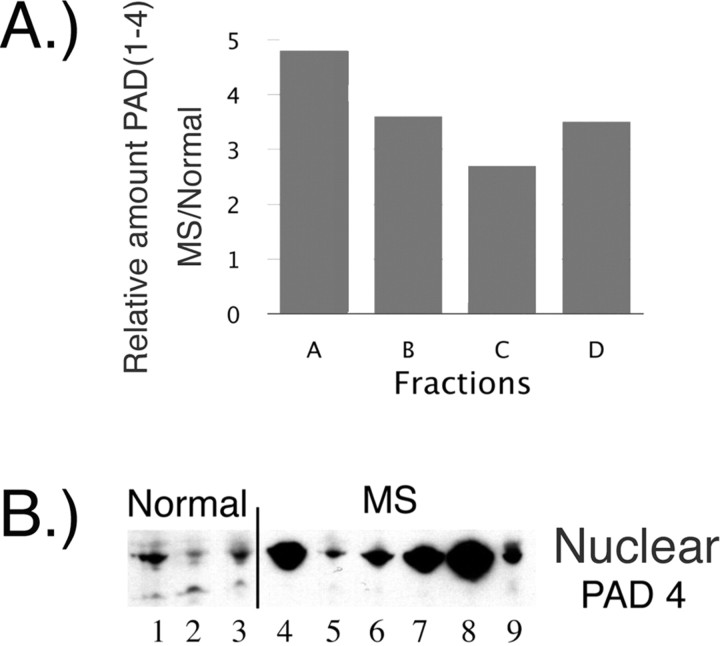
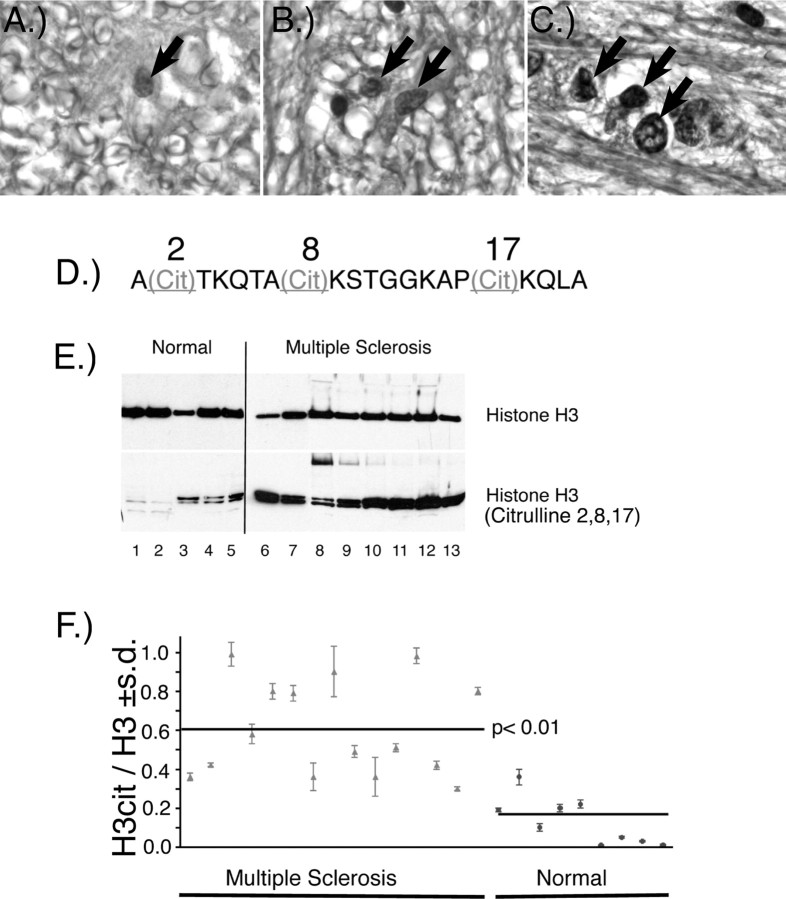
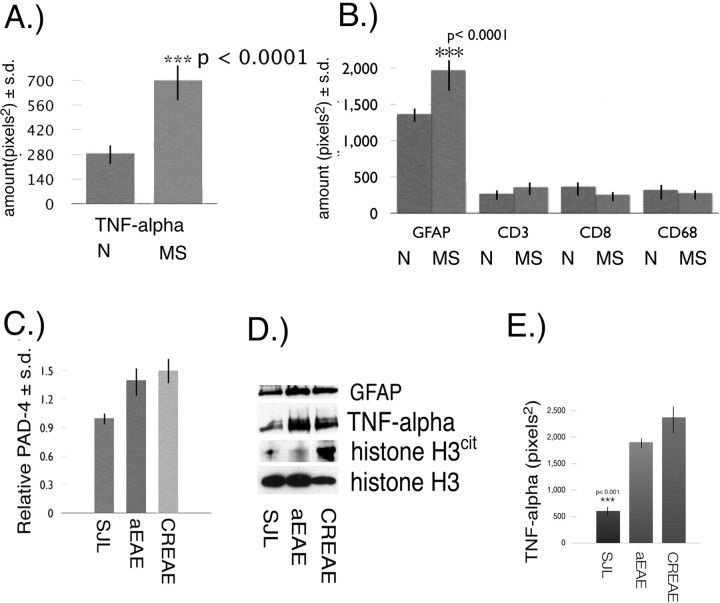
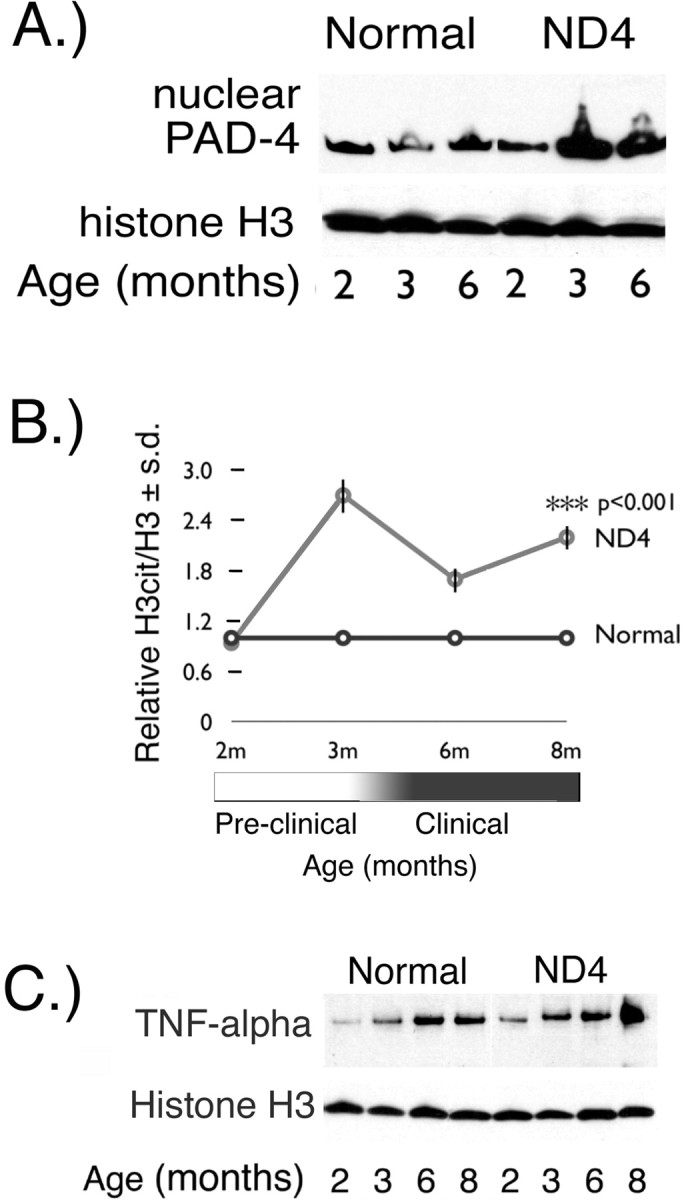
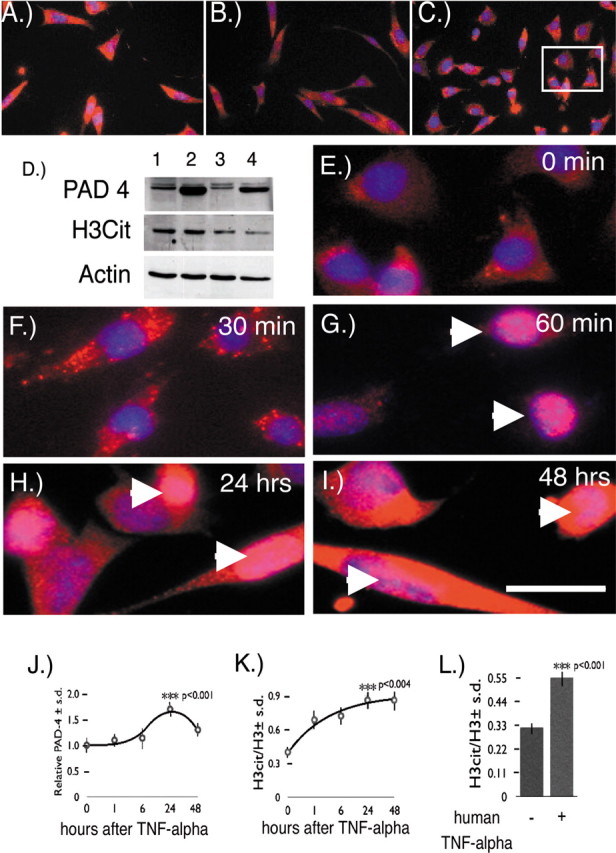
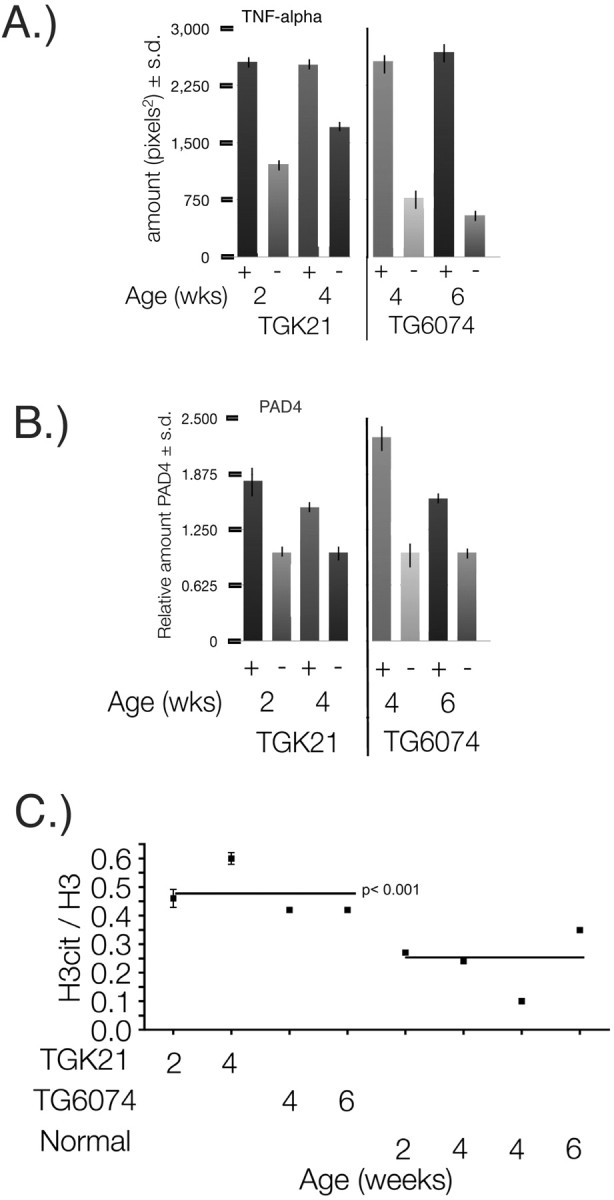
Modification of arginine residues by citrullination is catalyzed by peptidylarginine deiminases (PADs), of which five are known, generating irreversible protein structural modifications. We have shown previously that enhanced citrullination of myelin basic protein contributed to destabilization of the myelin membrane in the CNS of multiple sclerosis (MS) patients. We now report increased citrullination of nucleosomal histones by PAD4 in normal-appearing white matter (NAWM) of MS patients and in animal models of demyelination. Histone citrullination was attributable to increased levels and activity of nuclear PAD4. PAD4 translocation into the nucleus was attributable to elevated tumor necrosis factor-alpha (TNF-alpha) protein. The elevated TNF-alpha in MS NAWM was not associated with CD3+ or CD8+ lymphocytes, nor was it associated with CD68+ microglia/macrophages. GFAP, a measure of astrocytosis, was the only cytological marker that was consistently elevated in the MS NAWM, suggesting that TNF-alpha may have been derived from astrocytes. In cell cultures of mouse and human oligodendroglial cell lines, PAD4 was predominantly cytosolic but TNF-alpha treatment induced its nuclear translocation. To address the involvement of TNF-alpha in targeting PAD4 to the nucleus, we found that transgenic mice overexpressing TNF-alpha also had increased levels of citrullinated histones and elevated nuclear PAD4 before demyelination. In conclusion, high citrullination of histones consequent to PAD4 nuclear translocation is part of the process that leads to irreversible changes in oligodendrocytes and may contribute to apoptosis of oligodendrocytes in MS.


Figures

Figure 1.
Figure 1.
PAD4 in normal white matter and MS normal-appearing white matter. A, The differential distribution of PAD (1–4) proteins in MS samples was confirmed by fractionation of brain extracts into membrane (A + B), microsomal (C), and nuclear (D) fractions. The amount of total PAD protein was measured, and the results are presented as a bar graph of values in MS samples relative to normal controls. B, Anti-PAD4 Western blot of nuclear fraction from cortical white matter further supported the increased levels of PAD4 in the nuclear fraction of MS sample compared with the levels in normal controls. The nuclear fractions used in the PAD4 Western blot were as follows: Normal 1, 2, and 3 are HSB 3236, 3276, and 3322; MS 4–9 are HSB 3502, 2429, 3522, 3509, 2800, and 2485, respectively. These individuals are described further in supplemental Table 1 (available at www.jneurosci.org as supplemental material).
Figure 2.
Figure 2.
Citrullinated histones in normal and MS brain and nuclear fractions. Immunohistochemical staining of normal (A, 400×), and MS (B, 400×; C, 1000× oil) white matter with anti-citrulline (F95) monoclonal antibody. Arrows indicate nuclear labeling with the F95 antibody. A more intense nuclear labeling was observed in the MS white matter. D, The sequence of the tri-citrullinated N-terminal histone H3 peptide in which the arginyl residues at positions 2, 8, and 17 are replaced by citrulline. E, Western immunoblot of nuclear fractions prepared from white matter from normal and MS individuals with anti-histone H3 and anti-H3cit. F, The ratio ± SD of H3cit/H3 in nuclear white matter fractions from normal and individuals with MS. The mean of the H3cit/H3 ratios for the MS and normal groups is indicated by the horizontal lines (p < 0.01, nonparametric test). A list of the clinical diagnosis for each of the samples used in these experiments and the values ± SD of the H3cit/H3 ratios are provided in supplemental Table 1 (available at www.jneurosci.org as supplemental material).
Figure 3.
Figure 3.
TNF-α and cytological markers in MS NAWM. A, Quantitation of TNF-α ± SD in white matter from normal (N) (n = 8) and NAWM from MS patients (n = 17) by immunoslot blot. B, Quantitation ± SD of GFAP, CD3, CD8, and CD68 levels in normal (N) white matter and MS NAWM. C, Relative amount of PAD4 ± SD in brain nuclear fractions from SJL, aEAE, and CREAE mice. D, Western blot of whole-brain proteins from SJL, aEAE, and CREAE mice with anti-GFAP, anti-TNF-α, anti-histone H3cit, and anti-histone H3. E, Amount of TNF-α ± SD (p < 0.001) in 5 μg of total brain proteins from SJL, aEAE, and CREAE mice.
Figure 4.
Figure 4.
Nuclear PAD4 protein and TNF-α in ND4 brain. A, Western blot with an anti-PAD4 polyclonal antibody of nuclear fractions prepared from 2-, 3-, and 6-month-old ND4 and normal littermates. Histone H3 immunoreactivity was used as a loading control. B, Nuclear PAD4 activity was measured by determining the H3cit/H3 ratio in ND4 brains relative to normal littermates from 2–8 months ± SD. C, TNF-α Western blot of whole-brain protein homogenates from normal and ND4 littermates at 2, 3, 6, and 8 months of age. Histone H3 immunoreactivity was used as a loading control.
Figure 5.
Figure 5.
PAD4 subcellular localization in the Oli-Neu oligodendrocyte cell line. A, PAD4 subcellular localization in immature Oli-Neu cells during growth revealed it to be cytosolic. B, Oli-Neu cells 1 d in differentiation media. C, Oli-Neu cells 5 d in differentiation media. The rectangle is an area magnified in E. D, PAD4 Western blot of cell extracts from proliferating Oli-Neu cells transfected with pcDNA plasmid (lane 1) and proliferating Oli-Neu cells transfected with mouse PAD4 cDNA in a pcDNA plasmid (lane 2). Differentiating cells transfected with pcDNA plasmid (lane 3) and differentiating cells transfected with mouse PAD4 cDNA in a pcDNA-plasmid (lane 4) are shown. H3cit Western blot of whole-cell extracts from proliferating Oli-Neu cells (lanes 1, 2) and differentiating Oli-Neu cells (lanes 3, 4) is shown. Actin was used as a loading control in the Western blot. E, Oli-Neu cells (0 min TNF-α exposure). PAD4 was labeled with red fluorescence. Nuclei were labeled with DAPI (blue fluorescent label). F, Oli-Neu cells stained for PAD4 (red label) and nuclei with DAPI (blue label) after 30 min TNF-α exposure. G, PAD4 translocated into nuclei indicated by arrowheads after 60 min TNF-α exposure. H, I, PAD4 persisted in Oli-Neu nuclei (arrowheads) after 24 h (H) and 48 h (I). Scale bar, 50 μm. J, K, Quantitation of the relative amount of PAD4 (J) and the ratio of H3cit/H3 in Oli-Neu cells exposed to TNF-α after 0, 1, 6, 24, and 48 h (K). Each time point was assayed 12 times ± SD except the 6 and 48 h times, which were assayed six times ± SD. The p values for both PAD4 levels and the H3cit/H3 ratios were for the 0 and 24 h after TNF-α exposure. L, Quantitation of the ratio of H3cit/H3 ± SD (p < 0.001) in MO3-13 human oligodendrocytes exposed to recombinant human TNF-α for 24 h.
Figure 6.
Figure 6.
Nuclear PAD4 and TNF-α in TGK21and TG6074 brains. A, Quantitation of TNF-α in whole-brain homogenates from TGK21 (+), TG6074 (+), and nontransgenic littermates (−) from 2-week-old TGK21 (preclinical), 4-week-old TGK21 (clinical), 4-week-old TG6074 (preclinical), and 6-week-old TG6074 (clinical) mice (p < 0.001). B, Relative PAD4 levels in TGK21 (+) and TG6074 (+) transgenic mouse brains compared with nontransgenic (−) littermates at 2, 4, and 6 weeks of age. C, Ratios of nuclear citrullinated proteins/H3 ± SD in brain nuclear protein extracts from individual TGK21 (+) and TG6074 (+) transgenic mice compared with nontransgenic littermates (−). The means of the H3cit/H3 ratios for the TGK21and TG6074 transgenic mouse groups compared with their nontransgenic littermates are represented by the horizontal lines (p < 0.001, nonparametric test).

Similar articles

Cited by

References

    1. Akassoglou K, Probert L, Kontogeorgos G, Kollias G. Astrocyte-specific but not neuron-specific transmembrane TNF triggers inflammation and degeneration in the central nervous system of transgenic mice. J Immunol. 1997;158:438–445. - PubMed
    1. Akassoglou K, Bauer J, Kassiotis G, Pasparakis M, Lassmann H, Kollias G, Probert L. Oligodendrocyte apoptosis and primary demyelination induced by local TNF/p55TNF receptor signaling in the central nervous system of transgenic mice: models for multiple sclerosis with primary oligodendrogliopathy. Am J Pathol. 1998;153:801–813. - PMC - PubMed
    1. Akassoglou K, Bauer J, Kassiotis G, Lassmann H, Kollias G, Probert L. Transgenic models of TNF induced demyelination. Adv Exp Med Biol. 1999;468:245–259. - PubMed
    1. Akiyama K, Sakurai Y, Asou H, Senshu T. Localization of peptidylarginine deiminase type II in a stage-specific immature oligodendrocyte from rat cerebral hemisphere. Neurosci Lett. 1999;274:53–55. - PubMed
    1. Brooks WH. Autoimmune disorders result from loss of epigenetic control following chromosome damage. Med Hypotheses. 2005;64:590–598. - PubMed

Publication types

MeSH terms