. 2006 Nov 1;26(44):11413-22.
doi: 10.1523/JNEUROSCI.3340-06.2006.

Fusion of microglia with pyramidal neurons after retroviral infection

Affiliations

Fusion of microglia with pyramidal neurons after retroviral infection

James B Ackman et al. J Neurosci. .

Abstract

The neurogenic potential of the postnatal neocortex has not been tested previously with a combination of both retroviral and bromodeoxyuridine (BrdU) labeling. Here we report that injections of enhanced green fluorescent protein (eGFP) retrovirus into 134 postnatal rats resulted in GFP labeling of 642 pyramidal neurons in neocortex. GFP-labeled neocortical pyramidal neurons, however, unlike GFP-labeled glia, did not incorporate BrdU. Closer inspection of retrovirally labeled neurons revealed microglia fused to the apical dendrites of labeled pyramidal neurons. Retroviral infection of mixed cultures of cortical neurons and glia confirmed the presence of specific neuronal-microglial fusions. Microglia did not fuse to other glial cell types, and cultures not treated with retrovirus lacked microglial-neuronal fusion. Furthermore, activation of microglia by lipopolysaccharide greatly increased the virally induced fusion of microglia to neurons in culture. These results indicate a novel form of specific cell fusion between neuronal dendrites and microglia and further illustrate the need for caution when interpreting evidence for neuronogenesis in the postnatal brain.


Figures
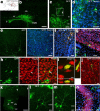
Figure 1.
Figure 1.
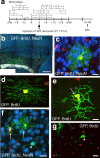
Retrovirally labeled neurons in the postnatal rat neocortex. a, Wistar rats received a single stereotaxic injection of a solution containing GFP retrovirus into the anterior SVZ. b, Low-magnification sagittal montage showing GFP-expressing cells in the cerebral cortex 9 d after stereotaxic injection of eGFP retrovirus into P11 wild-type rat. c, A deep layer GFP+ neuron from a P17 rat that received stereotaxic retrovirus injection at P11. The column of GFP+ glial cells next to the GFP+ neuron (arrow) is near the injection tract. d, Higher-magnification confocal image showing the same GFP+ neuron from c with the nuclear label TO-PRO-3 (blue). Note the inverted-type pyramidal morphology of the cell. e–g, Examples of deep layer pyramidal neurons labeled with the GFP retrovirus from an animal that received a 3 d survival (d.s.) after virus injection at P11. h–j, GFP+ neurons labeled with the retrovirus at P11 express markers for mature neurons. h, A GFP+ neuron expressing NeuN (red) from an animal that had a 9 d.s. after stereotaxic virus injection. i, Higher-magnification confocal z-section of the same cell from h with orthogonal views. j, A GFP-labeled neuron in layer VI from a 3 d.s. animal that is positive for a marker found in rat pyramidal neurons (RT-PYR, red). k, Low-magnification sagittal montage showing GFP-expressing cells in both the upper and lower cortical layers. Arrows indicate GFP+ neurons. l, m, Examples of GFP-labeled neurons in layers II/III from an animal that received a 3 d.s. after stereotaxic injection at P14. n, A GFP-labeled pyramidal neuron in hippocampal layer CA3 from an animal that received a 3 d.s. after retrovirus injection at P14. In all images, dorsal is up and rostral is to the right. ctx, Neocortex; lv, lateral ventricle; cc, corpus callosum. Scale bars: b, k, 500 μm; c, e, 100 μm; d, f, h, l–n, 40 μm; g, 50 μm; i, 10 μm; j, 20 μm.
Figure 2.
Figure 2.
BrdU is not incorporated into virally labeled neurons in postnatal rat neocortex. a, BrdU colabeling scheme. Postnatal rats received one to four BrdU injections (arrowheads) within 24 h of stereotaxic eGFP retrovirus injection. Each line segment indicates the approximate total S-phase time covered by the BrdU pulses given to each animal (n = 18 animals). Animals received 3–9 d survivals after surgery (SAC). b, Sagittal section of frontal cortex from a P20 wild-type animal that received stereotaxic injection of eGFP retrovirus at P11. The animal had received one BrdU injection 1 h after surgery. GFP+ cells (green) are predominant in the RMS and the white matter, with few scattered in neocortex. No BrdU+ nuclei (gray) are colabeled with the neuronal marker NeuN (blue). c, GFP retrovirally labeled astrocyte (green) that is positive for BrdU (red) but not NeuN (blue). d, GFP retrovirally labeled oligodendrocyte in the corpus callosum that is BrdU positive (red). e, GFP retrovirally labeled cell in neocortex with the morphology of a microglia cell (arrow) that is BrdU positive. f, GFP-labeled neuron (arrowhead) that is BrdU negative (red) but NeuN positive (blue). Two nearby glial cells (arrows) are BrdU positive (red). g, GFP-labeled neuron (arrowhead) that is BrdU negative. Scale bars: b, 500 μm; c, f, g, 20 μm; d, e, 10 μm.
Figure 3.
Figure 3.
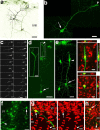
Fused neuronal–glial cells in postnatal rat neocortex. a, GFP+ layer II/III neurons from a P14 rat that received stereotaxic injection of eGFP retrovirus at P11. A secondary cell body (arrowheads) appears to be fused to the apical dendrite of each neuron (arrow and arrowhead pairs). The lookup table for the image is inversed and pseudocolored. b, Higher-magnification confocal image of one of the neurons from a. c, Series of 18 confocal z-sections (0.3 μm per optical section) of the cell indicated by the arrowhead in b. The primary process emanating from the small GFP+ secondary cell could not be distinguished from the apical dendrite of the GFP+ neuron. d, A labeled layer III neuron (arrow) with a secondary cell fused to its apical dendrite (arrowhead). The apical dendrite was followed in and out of a neighboring brain section. The inset shows the secondary cell body at higher magnification. e, GFP+ layer II/III neurons. One of the neurons (arrow) has a secondary cell fused to its apical dendrite (arrowhead). Panels at right show orthogonal views of the secondary cell body (top) and the neuronal cell body (bottom). The secondary cell is colabeled with TO-PRO-3 (red). f, GFP+ layer VI neuron with a secondary cell body (arrowhead) fused to one of the dendrites of the neuron (arrow). The column of GFP-expressing glial cells is near the injection site. g, A GFP+ layer VI neuron (arrow) that has a secondary cell fused to one of the dendrites in the corpus callosum (cc; arrowhead). Right panel is TO-PRO-3 (red) alone. h, Additional example of a labeled deep layer neuron with a secondary cell fused to a primary dendrite (TO-PRO-3, red). Scale bars: a, 50 μm; b, c, inset in d, orthogonal in e, 20 μm; d, 80 μm; e–h, 40 μm.
Figure 4.
Figure 4.
Cell fusion in primary cultures of cortical neurons. a, b, A GFP-labeled neuron from a primary cortical culture that received eGFP retrovirus at 33 DIV and fixed at 36 DIV. The GFP+ neuron (green; arrowhead) has a secondary cell body closely apposed to one of its dendrites (arrow). b, The GFP+ neuron is colabeled with the neuronal marker MAP-2 (red). Merged image is overlaid on a phase-contrast image of the culture. c, Higher magnification of same cells from b. Notice that the GFP+/MAP-2+ dendrite appears to course into the GFP+ secondary cell (bottom box). df, Higher-magnification image of the neuron from the top box in c. e–f, Wide-field epifluorescence images showing the nucleus of the neuron labeled with DAPI (blue). g–i, Higher-magnification images of the secondary cell from the bottom box in c. Notice that the GFP+ cytoplasm of the cell cannot be distinguished from the GFP+ neuronal dendrite (yellow). h, i, Wide-field epifluorescence images of the same cell in g showing the nucleus labeled with DAPI (blue). Notice that the GFP+ secondary cell contains weak MAP-2 reactivity (red) that cannot be distinguished from the MAP-2+ neuronal dendrite. j–l, Example of a labeled MAP-2+ neuron (arrowhead) that appears to have two secondary cells fused to one of its primary dendrites (arrow). m, n, Additional example of a labeled neuronal-secondary cell fusion (arrow, arrowhead). o, p, A GFP/MAP-2+ neuron (red) from a primary culture that received eGFP retrovirus. Notice that the GFP-negative neuron has two DAPI-positive nuclei (arrows) that appear to be fused to two of its primary dendrites. Scale bars: a, b, o, p, 50 μm; c, m, n, 20 μm; di, l, 10 μm; j, k, 40 μm.
Figure 5.
Figure 5.
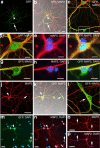
Neuron-fused glial cells are microglia. a, A GFP+ neuron in layer III, with a GFP+ cell fused to its apical dendrite (arrow). The right panel is a higher-magnification image of GFP+ cell indicated by arrow in the left panel. The cell is positive for the activated-microglia marker OX42 (red). The middle and bottom images are single optical sections. b, A GFP+ neuron in layer VI, with a GFP+ cell fused to dendrite in white matter (arrow). The dendrite of a neuron coursed out and back into the sagittal brain section. Middle and bottom are higher-magnification image of the GFP+ cell indicated by arrow in the top. The two bottom images are single optical sections. The cell is positive for OX42 (red). c, GFP+ fused-type glial cell (arrow) in white matter with GFP+ neuron in layer VI nearby. The fused cell is positive for the microglia marker IB4 (red). Examples of IB4+/GFP microglia are indicated by arrowheads. d, GFP+ neuron in layer II/III with a GFP+ cell fused to its apical dendrite (arrow). The fused cell is not positive for GFAP (red). TOPRO-3 is in blue. e, Another GFP+ neuron in layer II/III with a GFP+ cell fused to its apical dendrite (arrow). This fused cell is also not GFAP positive (red). f, GFP+ fused-type glial cell (arrow) in layer VI with GFP+ neuron in nearby. The fused-type glial cell is not positive for NG2 (magenta). The right column of f are single optical sections. Examples of NG2+/GFP cells are indicated by arrowheads. Scale bars: a, left, 40 μm; a, right, 20 μm; b, top, 40 μm; b, middle and bottom, 10 μm; c, d, e, 40 μm; f, 20 μm.
Figure 6.
Figure 6.
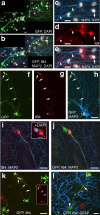
Cells fused to neurons in vitro are microglia. a, b, A GFP+ neuron from a 33 DIV primary cortical culture that received eGFP retrovirus at 30 DIV. The GFP+ neuron has a GFP+ cell (arrow in box) fused to its primary dendrite (arrowheads) that is IB4+ (red). MAP-2 is blue, and DAPI is gray. c–e, Higher magnification of the fused cell from the box in a. The fused cell is positive for IB4 (red, d) and MAP-2 (blue, c). Notice that IB4 and MAP-2 colocalize along the dendrite of the labeled neuron (arrowheads) distal to the fused cell body. f–h, A GFP+ neuron (asterisk) from a 32 DIV primary cortical culture that received eGFP retrovirus at 30 DIV. The GFP+ neuron has a GFP+ cell fused to one of its primary dendrites (top arrow). The fused cell and the neuronal dendrite is positive for IB4 (red, g) (n = 92 of 114 cells; n = 8 cultures). MAP-2 is in blue. i, j, Higher magnification of the microglial cell indicated by arrows in f–h. Both the GFP+ neuronal dendrite and portions of the microglial cell body exhibit immunoreactivity for the neuronal microtubule marker MAP-2 (blue). The inset wide-field image in i shows the DAPI+ nucleus within the IB4+ (red) cell body. k, A GFP+ neuron (asterisk) with a GFP+ cell fused to a primary dendrite (arrows). The reactivity for the microglial marker IB4 (red) colocalizes with the GFP+ fused cell and extends down into the proximal portions of the GFP+ neuronal dendrite (arrows). Arrowheads indicate other GFP+/IB4+ microglia nearby. l, A GFP+ neuron (arrowhead) with a GFP+/IB4+ microglial cell fused to its primary dendrite (arrow). The GFP+/IB4+ fused cell is not GFAP positive (blue). Scale bars: a–e, f–h, k, l, 40 μm; i, j, 20 μm; i, inset, 10 μm.
Figure 7.
Figure 7.
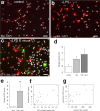
Activation of microglia increases the incidence of retrovirally labeled neurons and fusion. a, Image of IB4-positive microglia from an untreated primary cortical cell culture. Notice that the microglia cell bodies are small and round with occasional ramified processes extending from the soma. b, IB4-positive microglia from a culture that was incubated with the known microglia cell activator LPS (1 μg/ml). Notice that the IB4+ cells now have a large soma with ameboid appearance, a characteristic of activated microglia. c, A GFP+ neuron from a culture that received LPS and GFP retrovirus. The GFP+ neuron has a GFP+/IB4+ microglia fused to its primary dendrite. Notice the IB4+ microglia with large, ameboid cell bodies nearby. d, Index of IB4 labeling in LPS, LPS plus virus, and control cultures. The reactivity index is the average number of IB4+ cells for each condition expressed as a fraction of the total average IB4+ population for all conditions. e, Average number of GFP+ neurons in virus alone and LPS plus virus cultures. **p = 0.00375, Mann–Whitney U test. f, Plot of number of GFP neurons per culture (n = 16) with respect to the index of IB4+/GFP+ cell reactivity (number of IB4+/GFP+ microglia divided by number of total IB4+ cells). g, Plot of number of GFP neurons per culture with respect to the total number of IB4+ cells per culture. Scale bars: a–c, 40 μm.

Comment in

Similar articles

Cited by

References

    1. Alvarez-Dolado M, Pardal R, Garcia-Verdugo JM, Fike JR, Lee HO, Pfeffer K, Lois C, Morrison SJ, Alvarez-Buylla A. Fusion of bone-marrow-derived cells with Purkinje neurons, cardiomyocytes and hepatocytes. Nature. 2003;425:968–973. - PubMed
    1. Anderson JM. Multinucleated giant cells. Curr Opin Hematol. 2000;7:40–47. - PubMed
    1. Belluzzi O, Benedusi M, Ackman J, LoTurco JJ. Electrophysiological differentiation of new neurons in the olfactory bulb. J Neurosci. 2003;23:10411–10418. - PMC - PubMed
    1. Blumenthal R, Bali-Puri A, Walter A, Covell D, Eidelman O. pH-dependent fusion of vesicular stomatitis virus with Vero cells. Measurement by dequenching of octadecyl rhodamine fluorescence. J Biol Chem. 1987;262:13614–13619. - PubMed
    1. Brazelton TR, Rossi FM, Keshet GI, Blau HM. From marrow to brain: expression of neuronal phenotypes in adult mice. Science. 2000;290:1775–1779. - PubMed

Publication types

MeSH terms