Relationship between regional hemodynamic activity and simultaneously recorded EEG-theta associated with mental arithmetic-induced workload
- PMID: 17080437
- PMCID: PMC6871320
- DOI: 10.1002/hbm.20309
Relationship between regional hemodynamic activity and simultaneously recorded EEG-theta associated with mental arithmetic-induced workload
Abstract
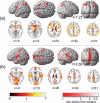
Theta increases with workload and is associated with numerous processes including working memory, problem solving, encoding, or self monitoring. These processes, in turn, involve numerous structures of the brain. However, the relationship between regional brain activity and the occurrence of theta remains unclear. In the present study, simultaneous EEG-fMRI recordings were used to investigate the functional topography of theta. EEG-theta was enhanced by mental arithmetic-induced workload. For the EEG-constrained fMRI analysis, theta-reference time-series were extracted from the EEG, reflecting the strength of theta occurrence during the time course of the experiment. Theta occurrence was mainly associated with activation of the insular cortex, hippocampus, superior temporal areas, cingulate cortex, superior parietal, and frontal areas. Though observation of temporal and insular activation is in accord with the theory that theta specifically reflects encoding processes, the involvement of several other brain regions implies that surface-recorded theta represents comprehensive functional brain states rather than specific processes in the brain. The results provide further evidence for the concept that emergent theta band oscillations represent dynamic functional binding of widely distributed cortical assemblies, essential for cognitive processing. This binding process may form the source of surface-recorded EEG theta.
2006 Wiley-Liss, Inc.
Figures


References
-
- Alexander GE, Moeller JR ( 1994): Application of the scaled subprofile model to functional imaging in neuropsychiatric disorders: a principal component approach to modeling brain function in disease. Hum Brain Mapp 2: 79–94.
-
- Allen JP, Polizzi G, Krakow K, Fish DR, Lemieux L ( 1998): Identification of EEG events in the MR scanner: the problem of pulse artifact and a method for its subtraction. Neuroimage 8: 229–239. - PubMed
-
- Allen JP, Josephs O, Turner R ( 2000): A method for removing imaging artifact from continuous EEG recorded during functional MRI. Neuroimage 12: 230–239. - PubMed
-
- Basar E ( 2005): Memory as the “whole brain work”: a large‐scale model based on “oscillations in super‐synergy.” Int J Psychophysiol 58: 199–226. - PubMed
-
- Cabeza R, Nyberg L ( 2000): Imaging cognition. II. An empirical review of 275 PET and fMRI studies. J Cogn Neurosci 12: 1–47. - PubMed
MeSH terms
LinkOut - more resources
Full Text Sources

