

3D geometric reconstruction of thoracic aortic aneurysms
- PMID: 17081301
- PMCID: PMC1635716
- DOI: 10.1186/1475-925X-5-59
3D geometric reconstruction of thoracic aortic aneurysms
Abstract
Background: The thoracic aortic aneurysm (TAA) is a pathology that involves an expansion of the aortic diameter in the thoracic aorta, leading to risk of rupture. Recent studies have suggested that internal wall stress, which is affected by TAA geometry and the presence or absence of thrombus, is a more reliable predictor of rupture than the maximum diameter, the current clinical criterion. Accurate reconstruction of TAA geometry is a crucial step in patient-specific stress calculations.
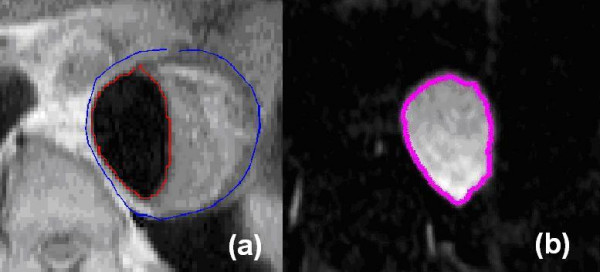
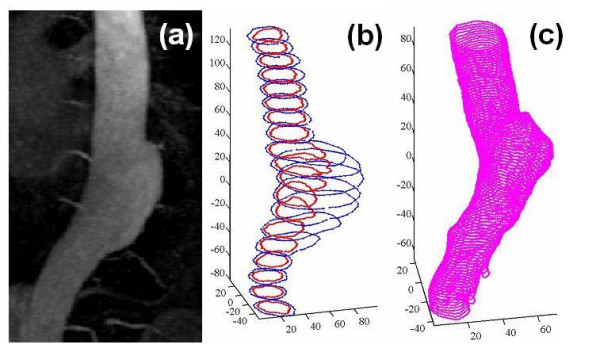
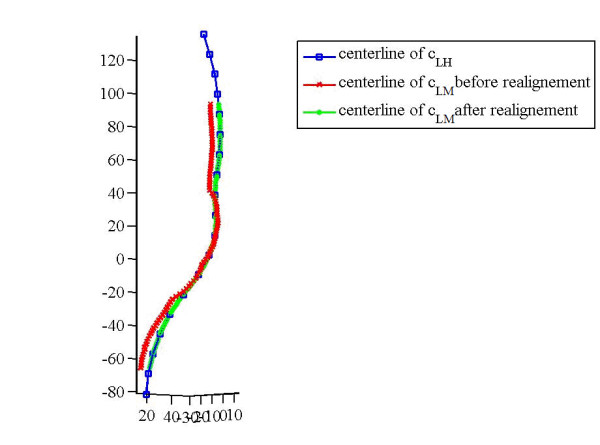
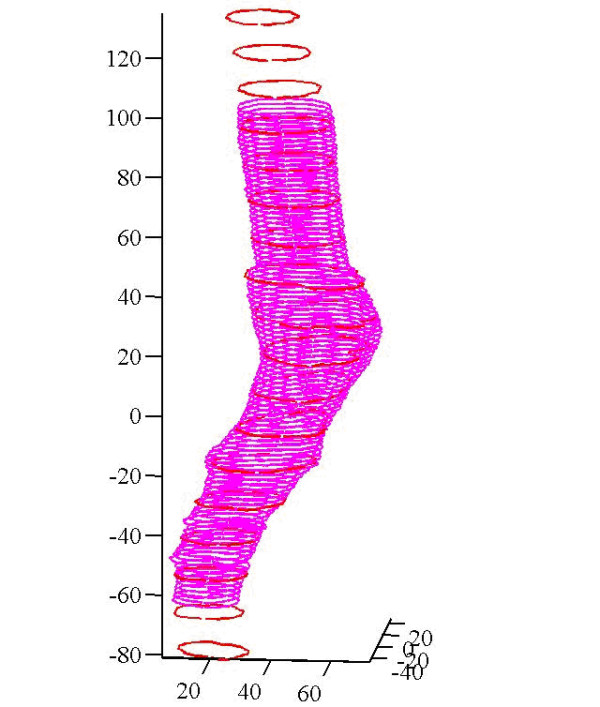
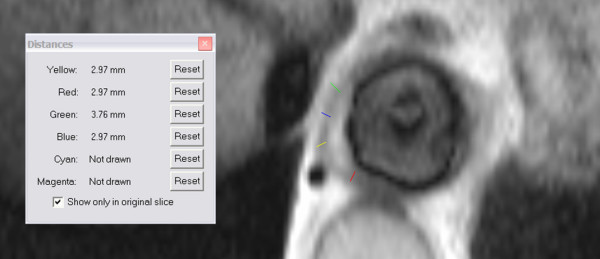
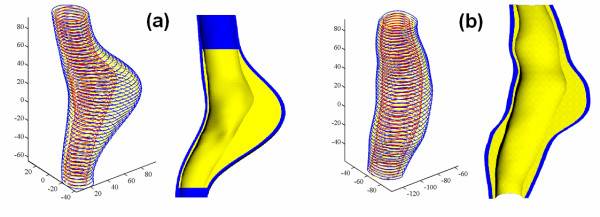
Methods: In this work, a novel methodology was developed, which combines data from several sets of magnetic resonance (MR) images with different levels of detail and different resolutions. Two sets of images were employed to create the final model, which has the highest level of detail for each component of the aneurysm (lumen, thrombus, and wall). A reference model was built by using a single set of images for comparison. This approach was applied to two patient-specific TAAs in the descending thoracic aorta.
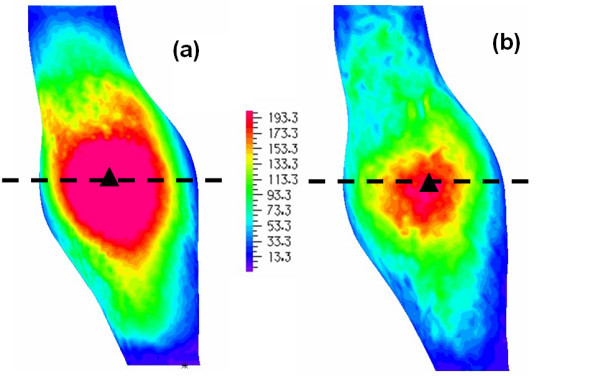
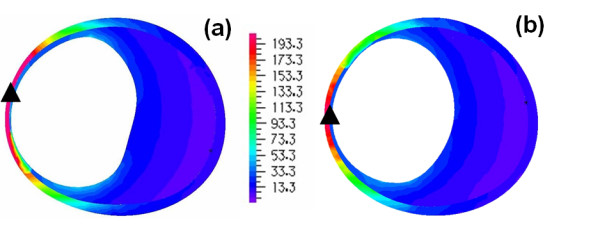
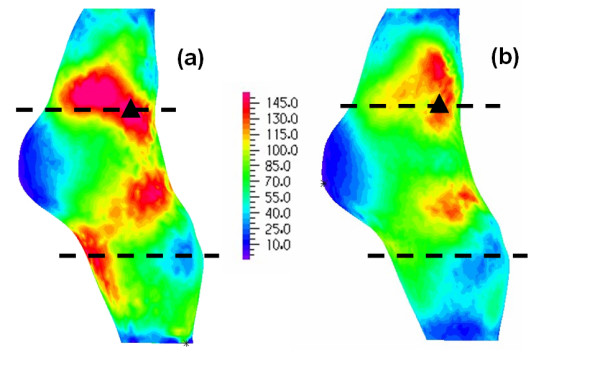
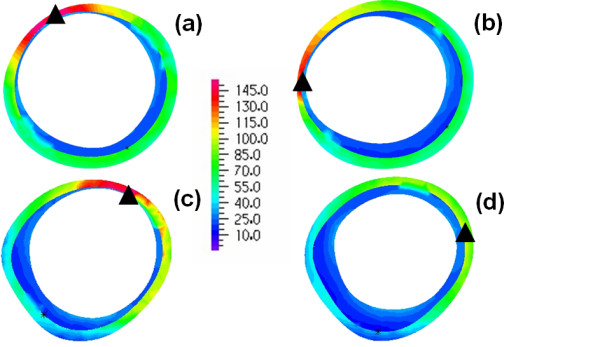
Results: The results of finite element simulations showed differences in stress pattern between the coarse and fine models: higher stress values were found with the coarse model and the differences in predicted maximum wall stress were 30% for patient A and 11% for patient B.
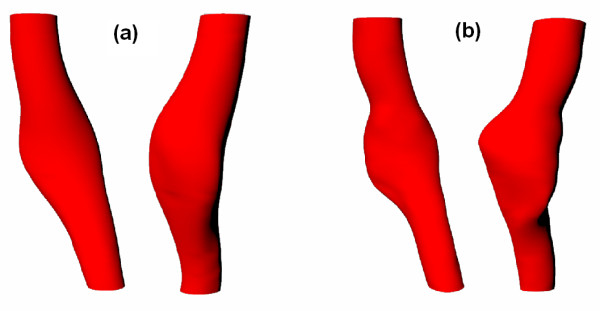
Conclusion: This paper presents a new approach to the reconstruction of an aneurysm model based on the use of several sets of MR images. This enables more accurate representation of not only the lumen but also the wall surface of a TAA taking account of intraluminal thrombus.
Figures
Similar articles
-
A patient-specific computational model of fluid-structure interaction in abdominal aortic aneurysms.Med Eng Phys. 2005 Dec;27(10):871-83. doi: 10.1016/j.medengphy.2005.06.008. Epub 2005 Sep 12. Med Eng Phys. 2005. PMID: 16157501
-
Three-dimensional sensitivity assessment of thoracic aortic aneurysm wall stress: a probabilistic finite-element study.Eur J Cardiothorac Surg. 2014 Mar;45(3):467-75. doi: 10.1093/ejcts/ezt400. Epub 2013 Aug 6. Eur J Cardiothorac Surg. 2014. PMID: 23921161
-
Fluid-structure interaction based study on the physiological factors affecting the behaviors of stented and non-stented thoracic aortic aneurysms.J Biomech. 2011 Aug 11;44(12):2177-84. doi: 10.1016/j.jbiomech.2011.06.020. Epub 2011 Jun 30. J Biomech. 2011. PMID: 21722905
-
Mechano-biology in the thoracic aortic aneurysm: a review and case study.Biomech Model Mechanobiol. 2014 Oct;13(5):917-28. doi: 10.1007/s10237-014-0557-9. Epub 2014 Feb 15. Biomech Model Mechanobiol. 2014. PMID: 24535084 Review.
-
Computational evaluation of aortic aneurysm rupture risk: what have we learned so far?J Endovasc Ther. 2011 Apr;18(2):214-25. doi: 10.1583/10-3244.1. J Endovasc Ther. 2011. PMID: 21521062 Review.
Cited by
-
Robust infrarenal aortic aneurysm lumen centerline detection for rupture status classification.Med Eng Phys. 2013 Sep;35(9):1358-67. doi: 10.1016/j.medengphy.2013.03.005. Epub 2013 Apr 20. Med Eng Phys. 2013. PMID: 23608300 Free PMC article.
-
Wall Shear Stress Estimation of Thoracic Aortic Aneurysm Using Computational Fluid Dynamics.Comput Math Methods Med. 2018 Jun 3;2018:7126532. doi: 10.1155/2018/7126532. eCollection 2018. Comput Math Methods Med. 2018. PMID: 30008797 Free PMC article.
-
Monitoring serial change in the lumen and outer wall of vertebrobasilar aneurysms.AJNR Am J Neuroradiol. 2008 Feb;29(2):259-64. doi: 10.3174/ajnr.A0796. Epub 2007 Nov 1. AJNR Am J Neuroradiol. 2008. PMID: 17974611 Free PMC article.
-
Structural modelling of the cardiovascular system.Biomech Model Mechanobiol. 2018 Oct;17(5):1217-1242. doi: 10.1007/s10237-018-1024-9. Epub 2018 Jun 18. Biomech Model Mechanobiol. 2018. PMID: 29911296 Free PMC article. Review.
-
Cardiovascular magnetic resonance in Marfan syndrome.J Cardiovasc Magn Reson. 2013 Apr 15;15(1):33. doi: 10.1186/1532-429X-15-33. J Cardiovasc Magn Reson. 2013. PMID: 23587220 Free PMC article. Review.
References
-
- Joyce JW, Fairbairn JF, 2nd, Kincaid OW, Juergen JL. Aneurysms of the Thoracic Aorta. A Clinical Study with Special Reference to Prognosis. Circulation. 1964;29:176–181. - PubMed
-
- Fillinger MF, Marra SP, Raghavan ML, Kennedy FE. Prediction of rupture risk in abdominal aortic aneurysm during observation: wall stress versus diameter. J Vasc Surg. 2003;37:724–732. - PubMed
-
- Di Martino ES, Guadagni G, Fumero A, Ballerini G, Spirito R, Biglioli P, Redaelli A. Fluid-structure interaction within realistic three-dimensional models of the aneurysmatic aorta as a guidance to assess the risk of rupture of the aneurysm. Med Eng Phys. 2001;23:647–655. - PubMed
-
- Venkatasubramaniam AK, Fagan MJ, Mehta T, Mylankal KJ, Ray B, Kuhan G, Chetter IC, McCollum PT. A comparative study of aortic wall stress using finite element analysis for ruptured and non-ruptured abdominal aortic aneurysms. Eur J Vasc Endovasc Surg. 2004;28:168–176. - PubMed
-
- Papaharilaou Y, Ekaterinaris JA, Manousaki E, Katsamouris AN. A decoupled fluid structure approach for estimating wall stress in abdominal aortic aneurysms. J Biomech. 2006 - PubMed
