Comparative Study
. 2006 Nov 2;5(1):55.
doi: 10.1186/1476-4598-5-55.

Pathway-specific differences between tumor cell lines and normal and tumor tissue cells

Affiliations
Comparative Study

Pathway-specific differences between tumor cell lines and normal and tumor tissue cells

Adam Ertel et al. Mol Cancer. .

Abstract

Background: Cell lines are used in experimental investigation of cancer but their capacity to represent tumor cells has yet to be quantified. The aim of the study was to identify significant alterations in pathway usage in cell lines in comparison with normal and tumor tissue.

Methods: This study utilized a pathway-specific enrichment analysis of publicly accessible microarray data and quantified the gene expression differences between cell lines, tumor, and normal tissue cells for six different tissue types. KEGG pathways that are significantly different between cell lines and tumors, cell lines and normal tissues and tumor and normal tissue were identified through enrichment tests on gene lists obtained using Significance Analysis of Microarrays (SAM).

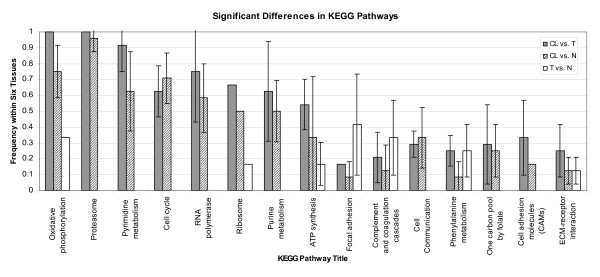
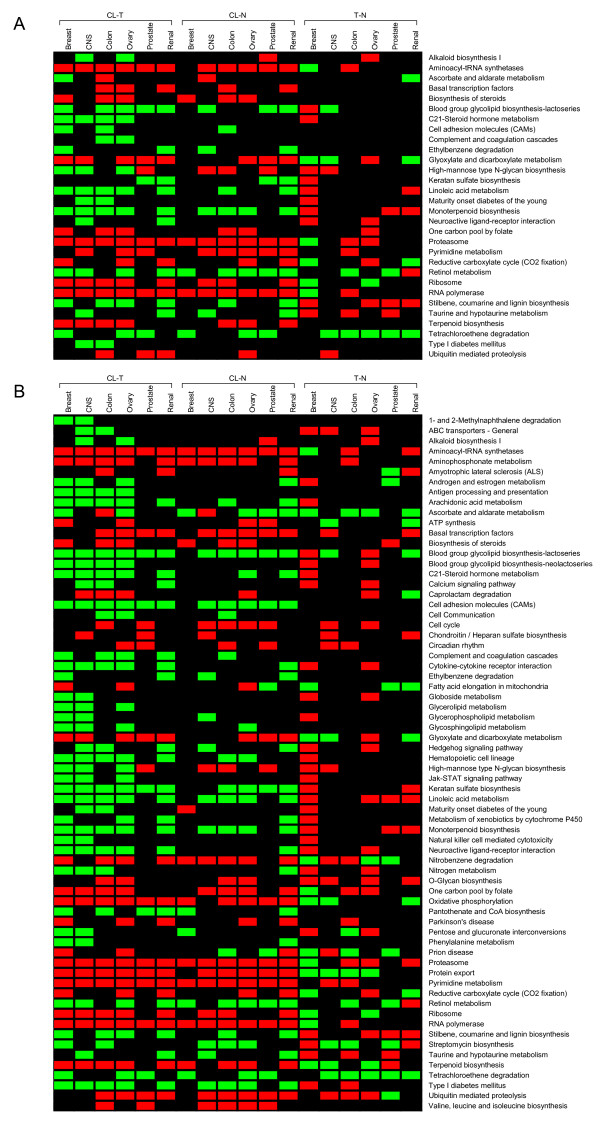
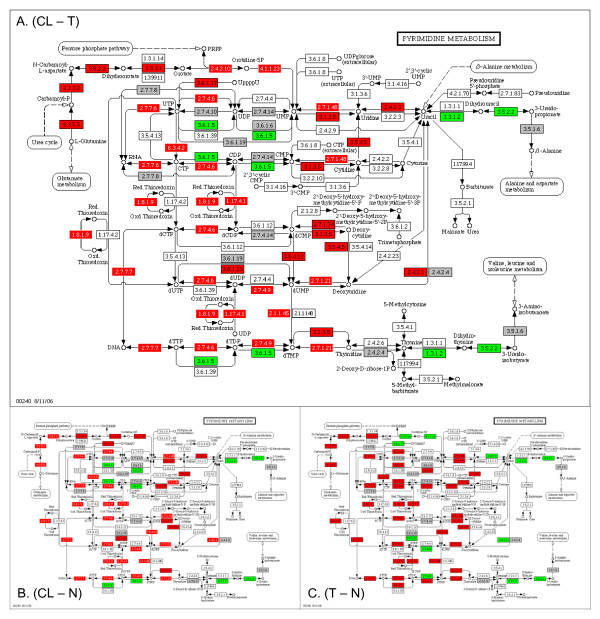
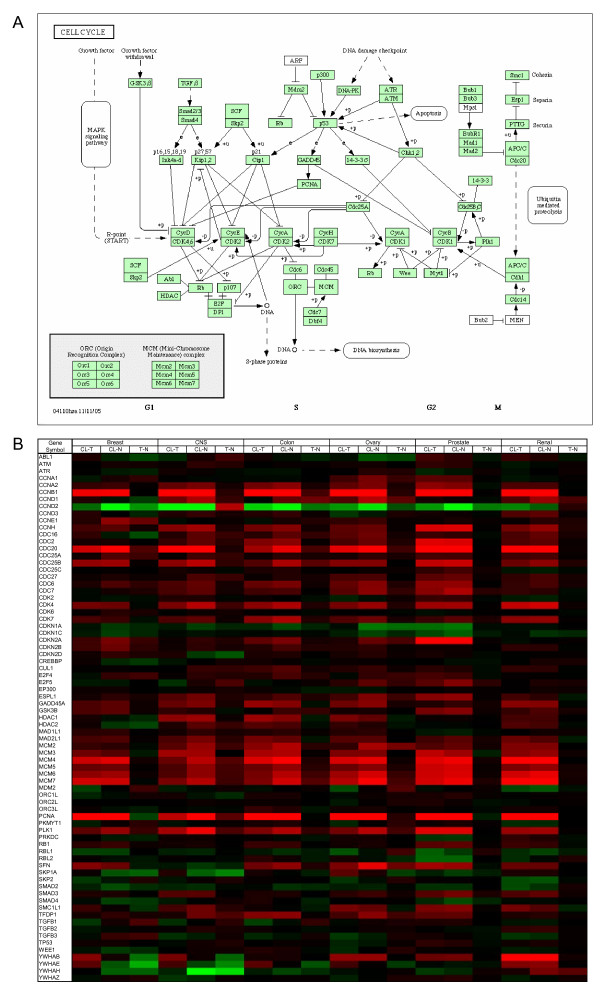
Results: Cellular pathways that were significantly upregulated in cell lines compared to tumor cells and normal cells of the same tissue type included ATP synthesis, cell communication, cell cycle, oxidative phosphorylation, purine, pyrimidine and pyruvate metabolism, and proteasome. Results on metabolic pathways suggested an increase in the velocity nucleotide metabolism and RNA production. Pathways that were downregulated in cell lines compared to tumor and normal tissue included cell communication, cell adhesion molecules (CAMs), and ECM-receptor interaction. Only a fraction of the significantly altered genes in tumor-to-normal comparison had similar expressions in cancer cell lines and tumor cells. These genes were tissue-specific and were distributed sparsely among multiple pathways.

Conclusion: Significantly altered genes in tumors compared to normal tissue were largely tissue specific. Among these genes downregulation was a major trend. In contrast, cell lines contained large sets of significantly upregulated genes that were common to multiple tissue types. Pathway upregulation in cell lines was most pronounced over metabolic pathways including cell nucleotide metabolism and oxidative phosphorylation. Signaling pathways involved in adhesion and communication of cultured cancer cells were downregulated. The three way pathways comparison presented in this study brings light into the differences in the use of cellular pathways by tumor cells and cancer cell lines.


Figures

Figure 1
Figure 1
KEGG pathways identified to be significantly altered in cell lines and tumors (CL - T), cell lines and normal tissue (CL - N), and tumor and normal tissue (T - N) comparisons. The term frequency shown in the figure is defined as the ratio of tissue types for which a pathway identified as significantly altered to the total number of tissue types (6). KEGG pathways were identified as significantly altered by using a hypergeometric test with a p-value cutoff. The minimum number of SAM genes in each significantly altered pathway has been set to two. The error bars indicate the standard deviation of frequency for different p- value cutoffs (p = 0.001, 0.01, 0.05 and 0.1).
Figure 2
Figure 2
A module map showing the direction of regulation of cellular pathways that were identified as significantly altered in cell lines compared to tumor tissue (CL - T) in at least 2 of the 6 tissues considered in this study. In (a), a pathway is deemed significantly altered if at least 80% of the genes in the pathway are shifted in a common direction. In (b), a pathway is deemed significantly altered if at least 70% of the genes in the pathway are shifted in a common direction. The color red indicates an upregulated pathway, the color green indicates a downregulated pathway, and the color black indicates that the pathway was not significant in that comparison.
Figure 3
Figure 3
KEGG pyrimidine metabolism diagram. Gene expression shifts are projected from comparisons of cell line-to-tumor (CL - T), cell line-to-normal (CL - N), and tumor-to-normal (T - N) comparisons averaged over all six tissues. The color red indicates upregulated genes, green indicates downregulated genes and grey indicates the genes that are not on the microarray. Uncolored genes are not in the organism-specific pathway for Homo sapiens. A gene is identified as upregulated (downregulated) if its gene expression value averaged over 6 tissue types were greater (or lesser) in cell lines compared to tumor or normal tissue. Colored genes with white lettering were also identified with SAM in at least two tissues.
Figure 4
Figure 4
KEGG cell cycle diagram. Genes are shown (a) in a pathway map with genes specific to homo-sapiens shaded light green and (b) tabulated with a color map showing average gene expression shifts for samples within the six tissues. Red indicates a positive change and green indicates a negative change in average RMA value for the respective cell line-tumor (CL - T), cell line-normal (CL - N), and tumor-normal (T - N) comparisons, with color scale limits set to -2 and +2.

Similar articles

Cited by

References

    1. Yamori T. Panel of human cancer cell lines provides valuable database for drug discovery and bioinformatics. Cancer Chemother Pharmacol. 2003;52:S74–9. doi: 10.1007/s00280-003-0649-1. - DOI - PubMed
    1. Kim JB, Stein R, O'Hare MJ. Three-dimensional in vitro tissue culture models of breast cancer – a review. Breast Cancer Res Treat. 2004;85:281–91. doi: 10.1023/B:BREA.0000025418.88785.2b. - DOI - PubMed
    1. Price JE, Zhang RD. Studies of human breast cancer metastasis using nude mice. Cancer Metastasis Rev. 1990;8:285–297. doi: 10.1007/BF00052605. - DOI - PubMed
    1. Ross DT, Perou CM. A comparison of gene expression signatures from breast tumors and breast tissue derived cell lines. Dis Markers. 2001;17:99–109. - PMC - PubMed
    1. Stein WD, Litman T, Fojo T, Bates SE. A Serial Analysis of Gene Expression (SAGE) database analysis of chemosensitivity: comparing solid tumors with cell lines and comparing solid tumors from different tissue origins. Cancer Res. 2004;64:2805–16. doi: 10.1158/0008-5472.CAN-03-3383. - DOI - PubMed

Publication types

LinkOut - more resources