A single amino acid difference within the alpha-2 domain of two naturally occurring equine MHC class I molecules alters the recognition of Gag and Rev epitopes by equine infectious anemia virus-specific CTL
- PMID: 17082657
- PMCID: PMC3342702
- DOI: 10.4049/jimmunol.177.10.7377
A single amino acid difference within the alpha-2 domain of two naturally occurring equine MHC class I molecules alters the recognition of Gag and Rev epitopes by equine infectious anemia virus-specific CTL
Abstract
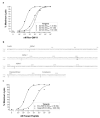
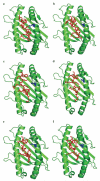
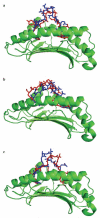
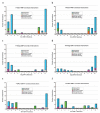
Although CTL are critical for control of lentiviruses, including equine infectious anemia virus, relatively little is known regarding the MHC class I molecules that present important epitopes to equine infectious anemia virus-specific CTL. The equine class I molecule 7-6 is associated with the equine leukocyte Ag (ELA)-A1 haplotype and presents the Env-RW12 and Gag-GW12 CTL epitopes. Some ELA-A1 target cells present both epitopes, whereas others are not recognized by Gag-GW12-specific CTL, suggesting that the ELA-A1 haplotype comprises functionally distinct alleles. The Rev-QW11 CTL epitope is also ELA-A1-restricted, but the molecule that presents Rev-QW11 is unknown. To determine whether functionally distinct class I molecules present ELA-A1-restricted CTL epitopes, we sequenced and expressed MHC class I genes from three ELA-A1 horses. Two horses had the 7-6 allele, which when expressed, presented Env-RW12, Gag-GW12, and Rev-QW11 to CTL. The other horse had a distinct allele, designated 141, encoding a molecule that differed from 7-6 by a single amino acid within the alpha-2 domain. This substitution did not affect recognition of Env-RW12, but resulted in more efficient recognition of Rev-QW11. Significantly, CTL recognition of Gag-GW12 was abrogated, despite Gag-GW12 binding to 141. Molecular modeling suggested that conformational changes in the 141/Gag-GW12 complex led to a loss of TCR recognition. These results confirmed that the ELA-A1 haplotype is comprised of functionally distinct alleles, and demonstrated for the first time that naturally occurring MHC class I molecules that vary by only a single amino acid can result in significantly different patterns of epitope recognition by lentivirus-specific CTL.
Figures


Similar articles
-
Presentation and binding affinity of equine infectious anemia virus CTL envelope and matrix protein epitopes by an expressed equine classical MHC class I molecule.J Immunol. 2003 Aug 15;171(4):1984-93. doi: 10.4049/jimmunol.171.4.1984. J Immunol. 2003. PMID: 12902502
-
Early detection of dominant Env-specific and subdominant Gag-specific CD8+ lymphocytes in equine infectious anemia virus-infected horses using major histocompatibility complex class I/peptide tetrameric complexes.Virology. 2005 Aug 15;339(1):110-26. doi: 10.1016/j.virol.2005.05.025. Virology. 2005. PMID: 15979679 Free PMC article.
-
Structural Illumination of Equine MHC Class I Molecules Highlights Unconventional Epitope Presentation Manner That Is Evolved in Equine Leukocyte Antigen Alleles.J Immunol. 2016 Feb 15;196(4):1943-54. doi: 10.4049/jimmunol.1501352. Epub 2016 Jan 13. J Immunol. 2016. PMID: 26764037
-
Cytotoxic T lymphocytes in protection against equine infectious anemia virus.Anim Health Res Rev. 2004 Dec;5(2):271-6. doi: 10.1079/ahr200482. Anim Health Res Rev. 2004. PMID: 15984338 Review.
-
Rev variation during persistent lentivirus infection.Viruses. 2011 Jan;3(1):1-11. doi: 10.3390/v3010001. Epub 2011 Jan 11. Viruses. 2011. PMID: 21994723 Free PMC article. Review.
Cited by
-
Cloning and large-scale expansion of epitope-specific equine cytotoxic T lymphocytes using an anti-equine CD3 monoclonal antibody and human recombinant IL-2.Vet Immunol Immunopathol. 2007 Jul 15;118(1-2):121-8. doi: 10.1016/j.vetimm.2007.04.001. Epub 2007 Apr 8. Vet Immunol Immunopathol. 2007. PMID: 17498813 Free PMC article.
-
The determination of in vivo envelope-specific cell-mediated immune responses in equine infectious anemia virus-infected ponies.Vet Immunol Immunopathol. 2012 Aug 15;148(3-4):302-10. doi: 10.1016/j.vetimm.2012.06.018. Epub 2012 Jun 23. Vet Immunol Immunopathol. 2012. PMID: 22795699 Free PMC article.
-
Failure of low-dose recombinant human IL-2 to support the survival of virus-specific CTL clones infused into severe combined immunodeficient foals: lack of correlation between in vitro activity and in vivo efficacy.Vet Immunol Immunopathol. 2008 Jan 15;121(1-2):8-22. doi: 10.1016/j.vetimm.2007.07.011. Epub 2007 Jul 25. Vet Immunol Immunopathol. 2008. PMID: 17727961 Free PMC article.
-
Development of a DNA microarray for detection of expressed equine classical MHC class I sequences in a defined population.Immunogenetics. 2010 Sep;62(9):633-9. doi: 10.1007/s00251-010-0463-y. Epub 2010 Aug 4. Immunogenetics. 2010. PMID: 20683590 Free PMC article.
-
Viral load and clinical disease enhancement associated with a lentivirus cytotoxic T lymphocyte vaccine regimen.Vaccine. 2009 Apr 21;27(18):2453-68. doi: 10.1016/j.vaccine.2009.02.048. Epub 2009 Feb 24. Vaccine. 2009. PMID: 19368787 Free PMC article.
References
-
- Addo MM, Altfeld M, Rosenberg ES, Eldridge RL, Philips MN, Habeeb K, Khatri A, Brander C, Robbins GK, Mazzara GP, et al. The HIV-1 regulatory proteins tat and rev are frequently targeted by cytotoxic T lymphocytes derived from HIV-1-infected individuals. Proc. Natl. Acad. Sci. USA. 98:1781–1786. - PMC - PubMed
-
- Betts MR, Krowka JF, Kepler TB, Davidian M, Christopherson C, Kwok S, Louie L, Eron J, Sheppard H, Frelinger JA. Human immunodeficiency virus type 1-specific cytotoxic T lymphocyte activity is inversely correlated with HIV type 1 viral load in HIV type 1-infected long-term survivors. AIDS Res. Hum. Retroviruses. 1999;15:1219–1228. - PubMed
-
- Gea-Banacloche JC, Migueles SA, Martino L, Shupert WL, McNeil AC, Sabbaghian MS, Ehler L, Prussin C, Stevens R, Lambert L, et al. Maintenance of large numbers of virus-specific CD8+ T cells in HIV-infected progressors and long-term nonprogressors. J. Immunol. 2000;165:1082–1092. - PubMed
-
- Klein MR, Van Baalen CA, Holwerda AM, Kerkhof Garde SR, Bende RJ, Keet IP, Eeftinck Schattenkerk JK, Osterhaus AD, Schuitemaker H, Miedema F. Kinetics of Gag-specific cytotoxic T lymphocyte responses during the clinical course of HIV-1 infection: a longitudinal analysis of rapid progressors and long-term asymptomatics. J. Exp. Med. 1995;181:1365–1372. - PMC - PubMed
Publication types
MeSH terms
Substances
Associated data
- Actions
Grants and funding
LinkOut - more resources
Full Text Sources
Research Materials

