

Optical-CT scanning of polymer gels
- PMID: 17082823
- PMCID: PMC1633726
- DOI: 10.1088/1742-6596/3/1/011
Optical-CT scanning of polymer gels
Abstract
The application of optical-CT scanning to achieve accurate high-resolution 3D dosimetry is a subject of current interest. The purpose of this paper is to provide a brief overview of past research and achievements in optical-CT polymer gel dosimetry, and to review current issues and challenges. The origins of optical-CT imaging of light-scattering polymer gels are reviewed. Techniques to characterize and optimize optical-CT performance are presented. Particular attention is given to studies of artifacts in optical-CT imaging, an important area that has not been well studied to date. The technique of optical-CT simulation by Monte-Carlo modeling is introduced as a tool to explore such artifacts. New simulation studies are presented and compared with experimental data.
Figures


Similar articles
-
Optical-CT gel-dosimetry I: basic investigations.Med Phys. 2003 Apr;30(4):623-34. doi: 10.1118/1.1559835. Med Phys. 2003. PMID: 12722814 Free PMC article.
-
Optical-CT gel-dosimetry. II: Optical artifacts and geometrical distortion.Med Phys. 2004 May;31(5):1093-104. doi: 10.1118/1.1655710. Med Phys. 2004. PMID: 15191297 Free PMC article.
-
High resolution gel-dosimetry by optical-CT and MR scanning.Med Phys. 2001 Jul;28(7):1436-45. doi: 10.1118/1.1380430. Med Phys. 2001. PMID: 11488576
-
Current status and new horizons in Monte Carlo simulation of X-ray CT scanners.Med Biol Eng Comput. 2007 Sep;45(9):809-17. doi: 10.1007/s11517-007-0207-9. Epub 2007 Jul 5. Med Biol Eng Comput. 2007. PMID: 17611789 Review.
-
Radiation dosimetry using polymer gels: methods and applications.Br J Radiol. 2000 Sep;73(873):919-29. doi: 10.1259/bjr.73.873.11064643. Br J Radiol. 2000. PMID: 11064643 Review.
Cited by
-
Characterization of a new radiochromic three-dimensional dosimeter.Med Phys. 2006 May;33(5):1338-45. doi: 10.1118/1.2192888. Med Phys. 2006. PMID: 16752569 Free PMC article.
-
3D dosimetry by optical-CT scanning.J Phys Conf Ser. 2006;56:58-71. doi: 10.1088/1742-6596/56/1/006. J Phys Conf Ser. 2006. PMID: 17460781 Free PMC article.
-
The Optical Coherence Tomography and Raman Spectroscopy for Sensing of the Bone Demineralization Process.Sensors (Basel). 2021 Sep 28;21(19):6468. doi: 10.3390/s21196468. Sensors (Basel). 2021. PMID: 34640787 Free PMC article.
-
A method to correct for stray light in telecentric optical-CT imaging of radiochromic dosimeters.Phys Med Biol. 2011 Jul 21;56(14):4433-51. doi: 10.1088/0031-9155/56/14/013. Epub 2011 Jun 30. Phys Med Biol. 2011. PMID: 21719946 Free PMC article.
-
Improvement of sensitivity of X-ray CT reading method for polymer gel in radiation therapy.Rep Pract Oncol Radiother. 2020 Jan-Feb;25(1):100-103. doi: 10.1016/j.rpor.2019.12.017. Epub 2019 Dec 19. Rep Pract Oncol Radiother. 2020. PMID: 31908601 Free PMC article.
References
-
- Gore JC, Ranade M, Maryanski MJ, Schulz RJ. Radiation dose distributions in three dimensions from tomographic optical density scanning of polymer gels: I. Development of an optical scanner. Phys. Med. Biol. 1996;41:2695–704. - PubMed
-
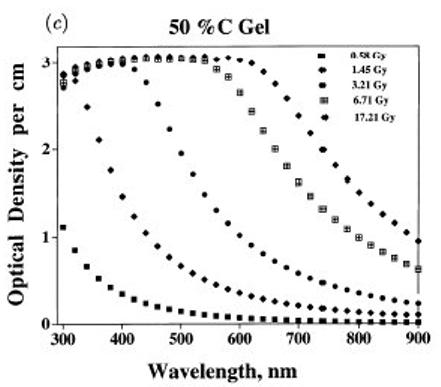
- Maryanski MJ, Zastavker YZ, Gore JC. Radiation dose distributions in three dimensions from tomographic optical density scanning of polymer gels: II. Optical properties of the BANG polymer gel. Phys. Med. Biol. 1996;41:2705–17. - PubMed
-
- Maryanski MJ, Gore JC, Kennan RP, Schulz RJ. NMR relaxation enhancement in gels polymerized and cross-linked by ionizing radiation: a new approach to 3D dosimetry by MRI. Magn. Reson. Imaging. 1993;11:253–8. - PubMed
-
- Oldham M, Baustert I, Lord C, Smith TA, McJury M, Warrington AP, Leach MO, Webb S. An investigation into the dosimetry of a nine-field tomotherapy irradiation using BANG-gel dosimetry. Phys. Med. Biol. 1998;43:1113–32. - PubMed
-
- Maryanski MJ, Ibbott GS, Eastman P, Schulz RJ, Gore JC. Radiation therapy dosimetry using magnetic resonance imaging of polymer gels. Med. Phys. 1996;23:699–705. - PubMed
Grants and funding
LinkOut - more resources
Full Text Sources
Miscellaneous