. 2006 Nov 3;2(11):e143.
doi: 10.1371/journal.pcbi.0020143.

The evolution of two-component systems in bacteria reveals different strategies for niche adaptation

Affiliations

The evolution of two-component systems in bacteria reveals different strategies for niche adaptation

Eric Alm et al. PLoS Comput Biol. .

Abstract

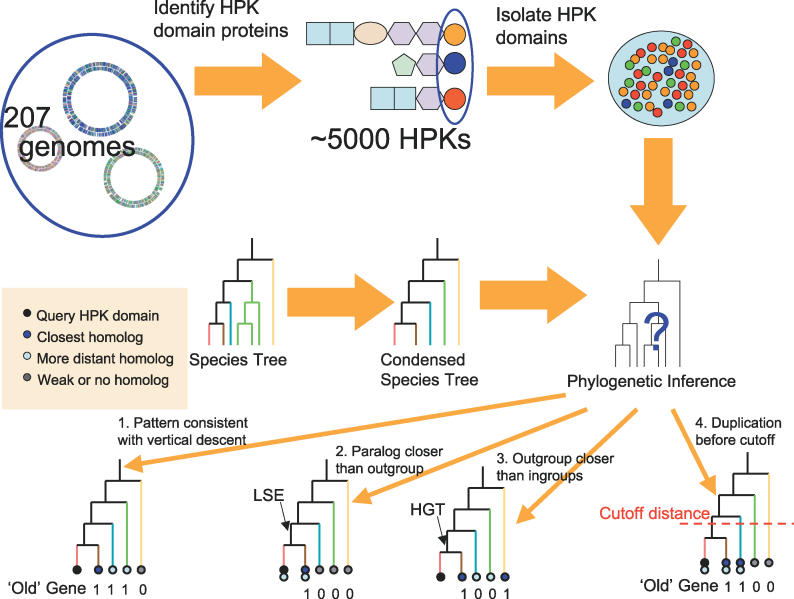
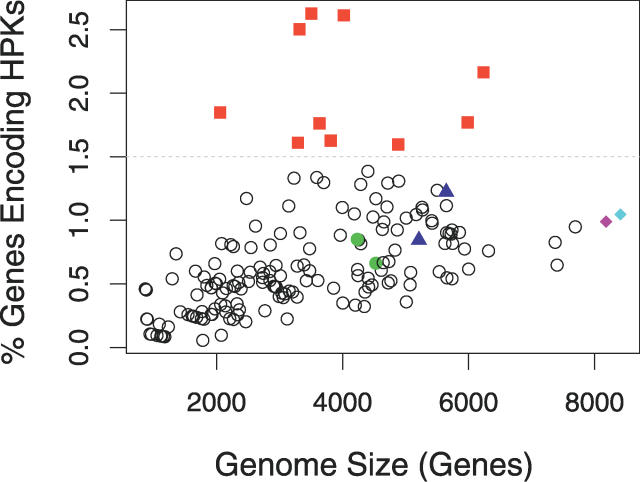
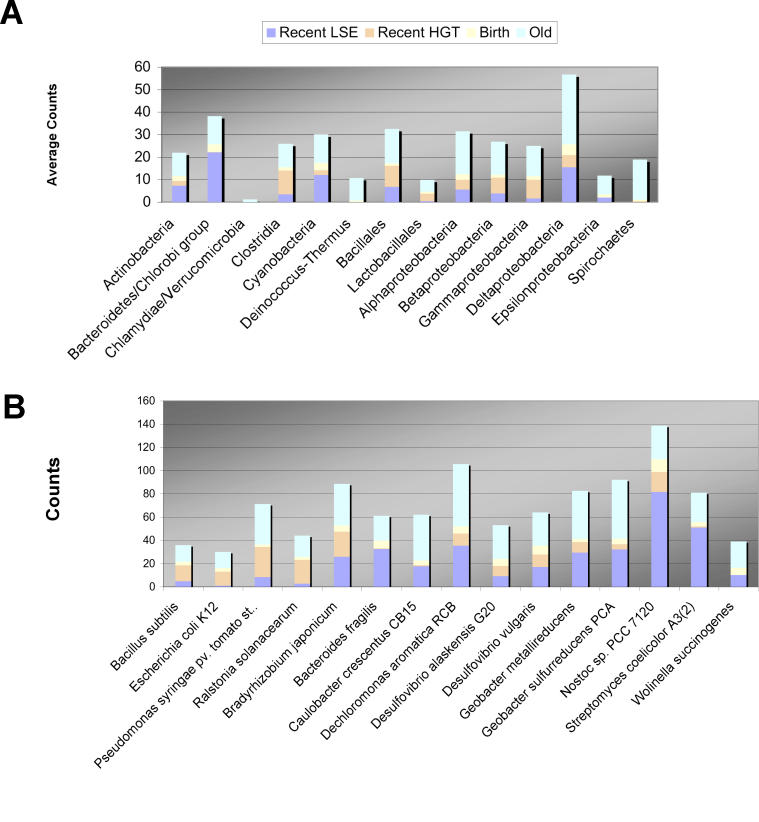
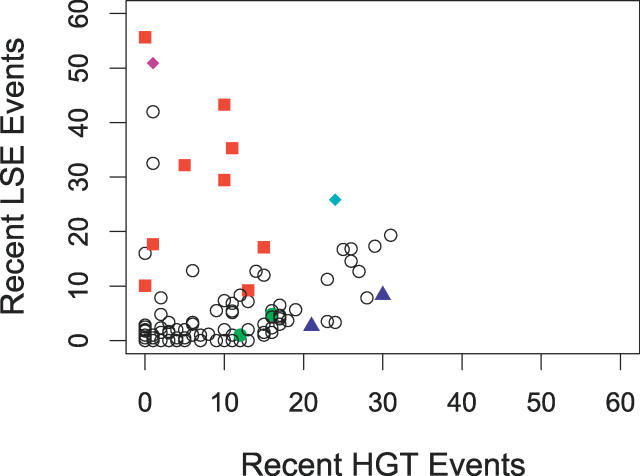
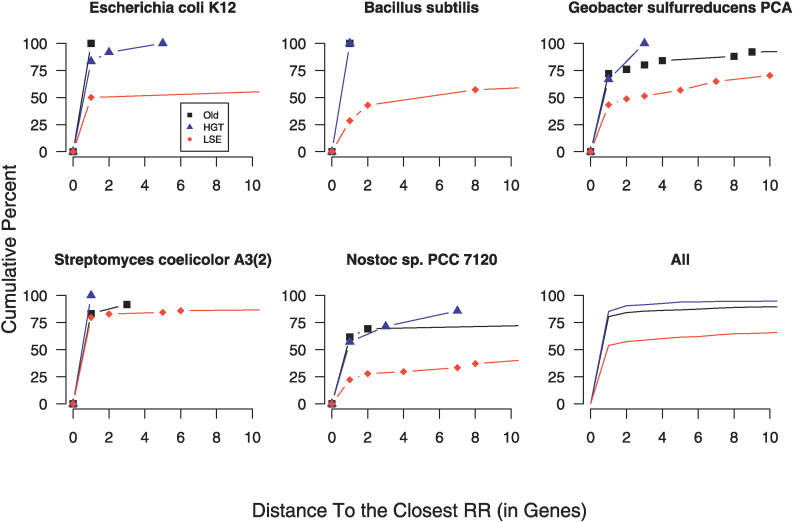
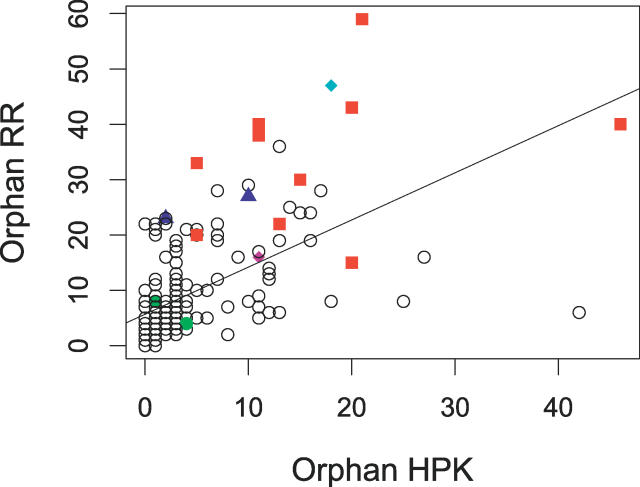
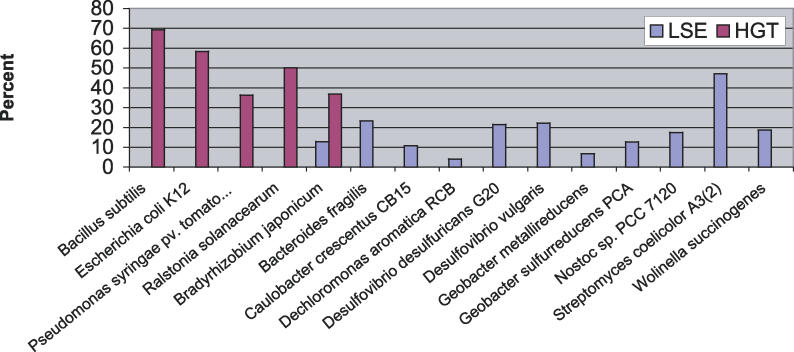
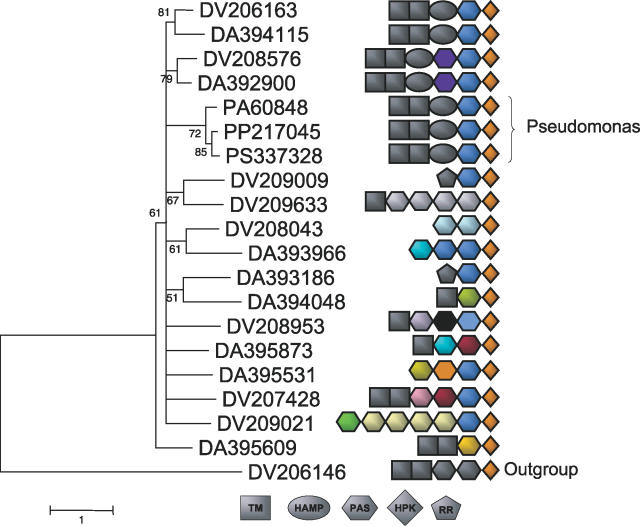
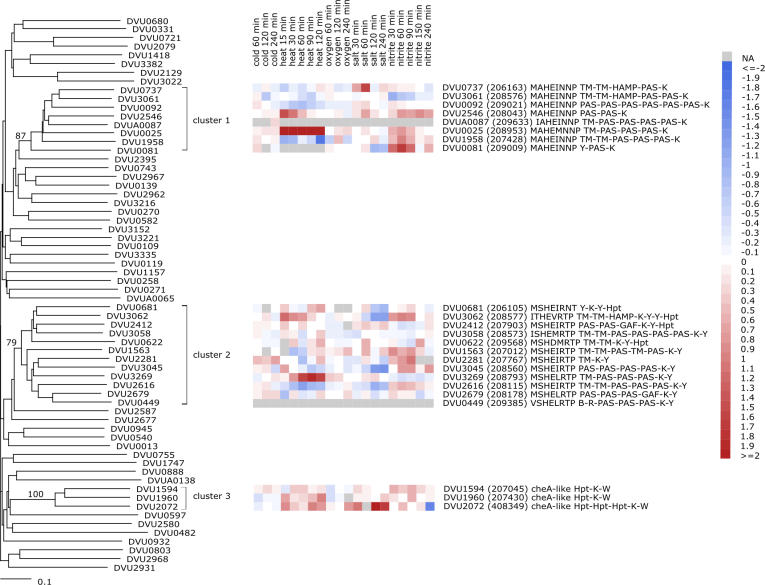
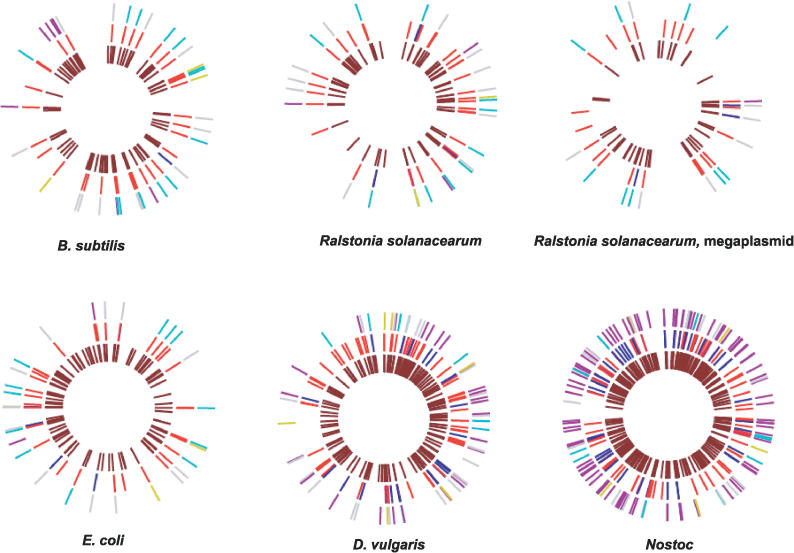
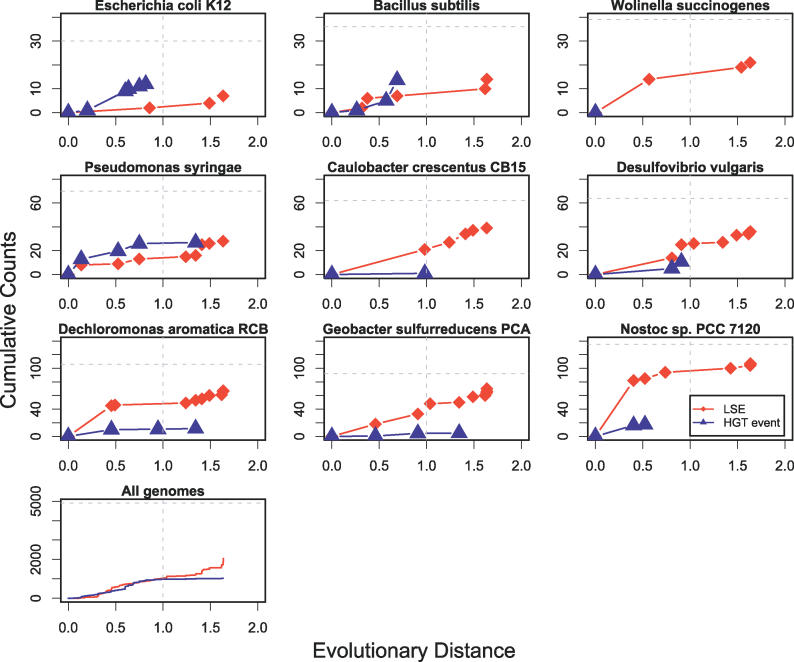
Two-component systems including histidine protein kinases represent the primary signal transduction paradigm in prokaryotic organisms. To understand how these systems adapt to allow organisms to detect niche-specific signals, we analyzed the phylogenetic distribution of nearly 5,000 histidine protein kinases from 207 sequenced prokaryotic genomes. We found that many genomes carry a large repertoire of recently evolved signaling genes, which may reflect selective pressure to adapt to new environmental conditions. Both lineage-specific gene family expansion and horizontal gene transfer play major roles in the introduction of new histidine kinases into genomes; however, there are differences in how these two evolutionary forces act. Genes imported via horizontal transfer are more likely to retain their original functionality as inferred from a similar complement of signaling domains, while gene family expansion accompanied by domain shuffling appears to be a major source of novel genetic diversity. Family expansion is the dominant source of new histidine kinase genes in the genomes most enriched in signaling proteins, and detailed analysis reveals that divergence in domain structure and changes in expression patterns are hallmarks of recent expansions. Finally, while these two modes of gene acquisition are widespread across bacterial taxa, there are clear species-specific preferences for which mode is used.


Conflict of interest statement

Competing interests. The authors have declared that no competing interests exist.

Figures

Figure 1
Figure 1. Overview of Approach
An overview of our phylogenetic inference procedure is given. We look only at histidine kinase domains from HPKs, and compare the distribution of these to the species tree. When homologs in distant outgroups are more distantly related, we infer simple vertical descent. Paralogs and distances that contradict species phylogeny result in our inference of gene duplication or horizontal transfer. Only events (such as duplication or transfer) that occurred more recently than the cutoff as described in the Methods are considered. Four hypothetical cases are shown, and each is labeled as present/absent (“1” or “0”) from each outgroup according to the procedure described in the Methods.
Figure 2
Figure 2. HPK Content versus Genome Size
The percent of each genome is plotted as a function of genome size. As reported in previous studies, there is a roughly linear correlation. Highlighted in colored symbols are several groups of genomes described in the text: genomes coding a high (≥1.5%) fraction of HPKs—red squares; the model organisms, E. coli and B. subtilis—green circles; genomes with a high number of HGT eventsblue triangles; Bradyrhizobium japonicum (high number of both HGT and LSE genes)pink diamond; and Streptomyces coelicolor (high percentage of LSE genes) turquoise diamond.
Figure 3
Figure 3. Summary of Evolutionary Events
The number of events inferred for different bacteria is summarized in this figure. (A) Average numbers for the major taxonomic groups used in this study. (B) Specific numbers for targeted genomes (those with colored symbols in Figure 1).
Figure 4
Figure 4. LSE Events versus HGT Events
The number of LSE and HGT events for each genome are shown. Colored symbols correspond to the genomes identified in Figure 1. Note the position of the red squares well above the x-axis.
Figure 5
Figure 5. Proximity of Different Classes of HPKs to RRs
Shown is the cumulative percentage of HPKs of each type that have RRs within the distance on the chromosome specified by the x-axis. The different gene types shown are: old HPKsblack squares (Old); HGT genes without recent paralogsblue triangles (HGT); and HPKs with recent paralogsred diamonds (LSE). In the bottom right panel, an average over all genomes is shown. In general, and for most specific cases (excepting Streptomyces), horizontally transferred genes are observed to have a much higher fraction of RRs in close genomic proximity. “Hybrid” HPKs, which have RRs in the same ORF as the HPK, were excluded from this analysis. Only genes that are not believed to have undergone duplication within a lineage are used in the HGT group. Lines stop when cumulative percentage equals 100%.
Figure 6
Figure 6. Coevolution of Orphan HPKs and RRs
The number of “orphan” HPKs is plotted versus the number of “orphan” RRs. A moderate but highly significant linear correlation is observed (ordinary least squares linear regression: r = 0.57, p < 10−15).
Figure 7
Figure 7. Extent of Domain Shuffling in Different Classes of HPKs
The fraction of HPKs with identical upstream domains to either their inferred HGT partners (red bars), or to their closest paralog (blue bars) in the case of LSE. Only genes that are not believed to have undergone duplication within a lineage are used in the HGT group. B. japonicum, which has a significant number of genes classified as HGT and LSE, is shown twice.
Figure 8
Figure 8. Domain Shuffling in a Desulfovibrio spp. Expansion
The domain structure of genes in a large LSE in the Desulfovibrio genus is shown. In addition, three similar proteins identified in Pseudomonas species are shown, which are likely the result of HGT. Genes are identified by their species name and their accession number in the MicrobesOnline database (http://microbesonline.org) for easy reference (DV refers to genes present in D. vulgaris and DA refers to genes present in D. alaskensis G20). Each domain corresponds to a branch of the TREE-PUZZLE phylogenetic tree (of only the HPK domains) shown at left. Each PAS domain is colored according to sequence homology (as inferred by BLASTp), and domains with the same color comprise subfamilies of closely related domains. While upstream domains are generally shuffled, each gene shown contains a PAS domain immediately preceding the conserved HPK domain. Moreover, this PAS domain is largely conserved among paralogs at the sequence level, while more N-terminal domains are not. Interestingly, the Pseudomonas gene, which we infer to be involved in a horizontal transfer event, has a set of signaling domains identical to one of the Desulfovibrio copies, suggesting a likely donor–acceptor pair, and highlighting the qualitative difference in genes acquired by HGT and LSE.
Figure 9
Figure 9. Gene Expression of D. vulgaris Expansions
Gene expression profiles across a compendium of experimental stress response conditions (NaCl, heat shock, cold shock, nitrite, and oxygen) were monitored using DNA microarrays, and shown next to a phylogenetic NJ tree (with 1,000 bootstraps, generated using the MEGA3 software package [28]) of all HPK domains in D. vulgaris. Blue colors indicate down-regulated genes (relative to unperturbed cells), and red colors indicate up-regulated genes. No significant excess correlation in gene expression was observed for genes within each cluster (compared with randomly chosen pairs of genes) using a Student's t-test to compare mean correlations or the Kolmogorov-Smirnov test to compare distributions. The domain structure of each gene in the three LSEs is shown to the right. Gene names are provided for all genes, and MicrobesOnline accession numbers are provided in parentheses for genes in each of the major clusters for comparison with Figure 8. Bootstrap values are provided for each of the major clusters, and the amino acid sequence of the “H-Box” motif for genes in each cluster is shown. A more detailed description of the experiments performed is given in Methods.
Figure 10
Figure 10. Genomic Distribution of HPKs and RRs
The position of signaling proteins in several genomes is shown. In the outer ring, HPKs of different classes are shown: Old (gray), LSE (purple), HGT without duplication (blue), and genes that recently underwent a “Birth” event (green). The middle ring shows the position of response regulators, with blue colors indicating hybrid response regulators (containing HPK domains). The inner ring shows the location of all genes in each genome annotated as signaling proteins according to the MicrobesOnline database [37].
Figure 11
Figure 11. HPK Evolution over Time
The number of HPKs entering a lineage is shown as a function of the time each HPK entered that lineage (i.e., the distance of that species to the last ancestor predicted to contain that HPK). Red lines/diamonds indicate LSE events, and blue lines/triangles indicate HGT events. Plots are cumulative showing all events dating more recently than the distance shown on the x-axis. HGT lines do not extend as far to the right as LSE lines, since they require genes to be lost from two consecutive outgroups. The vertical dashed line shows the phylogenetic cutoff distance, and the horizontal dashed line shows the total number of HPKs in each genome. Symbols indicate the evolutionary distance (arbitrary units; see Methods) of outgroups used in the analysis. Some clades with greater taxon sampling have better resolved timings. The last panel shows total numbers for all genomes.

References

    1. Ulrich LE, Koonin EV, Zhulin IB. One-component systems dominate signal transduction in prokaryotes. Trends Microbiol. 2005;13:52–56. - PMC - PubMed
    1. Galperin MY. A census of membrane-bound and intracellular signal transduction proteins in bacteria: Bacterial IQ, extroverts and introverts. BMC Microbiol. 2005;5:35. - PMC - PubMed
    1. Wolanin PM, Thomason PA, Stock JB. Histidine protein kinases: Key signal transducers outside the animal kingdom. Genome Biol. 2002;3:REVIEWS3013. - PMC - PubMed
    1. Rodrigue A, Quentin Y, Lazdunski A, Mejean V, Foglino M. Two-component systems in Pseudomonas aeruginosa: Why so many? Trends Microbiol. 2000;8:498–504. - PubMed
    1. Price MN, et al. Operon formation is driven by co-regulation and not by horizontal gene transfer. Genome Res. 2005;15:809–819. - PMC - PubMed

Publication types