. 2006 Aug 31;6(9):996-1007.
doi: 10.1167/6.9.12.

Nonlinearities in color coding: compensating color appearance for the eye's spectral sensitivity

Affiliations

Nonlinearities in color coding: compensating color appearance for the eye's spectral sensitivity

Yoko Mizokami et al. J Vis. .

Abstract

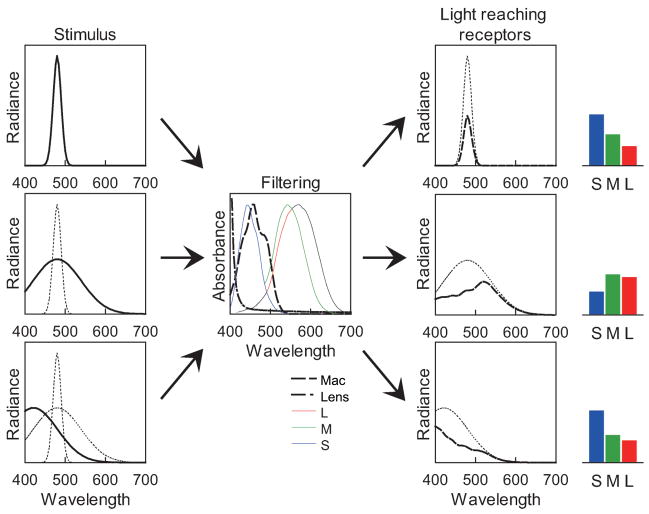
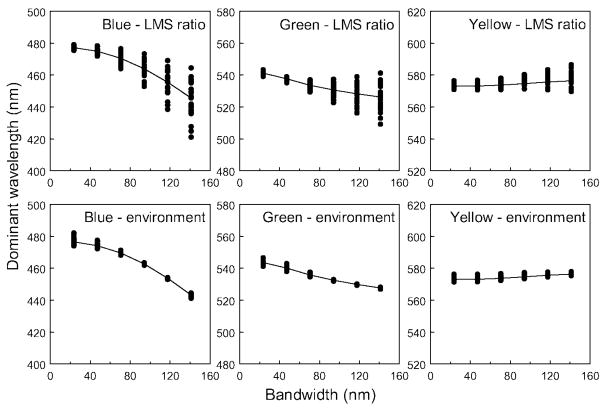
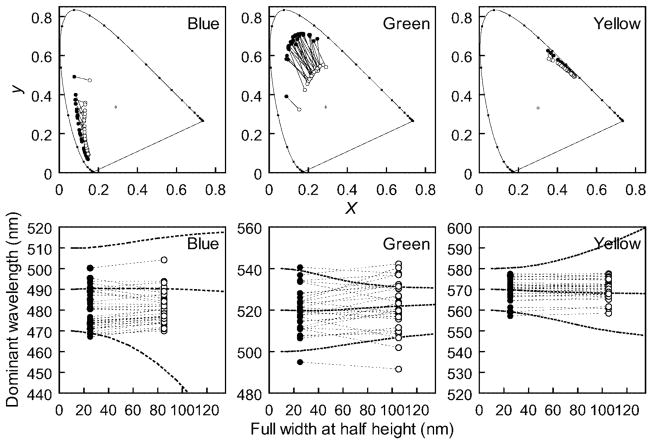
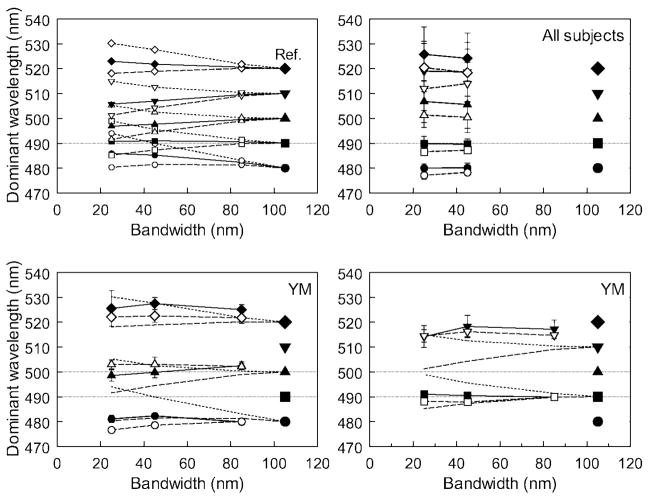
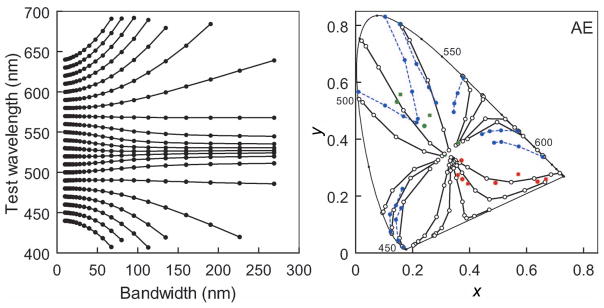
Most wavelengths change hue when mixed with white light. These changes, known as the Abney effect, have been extensively studied to characterize nonlinearities in the neural coding of color, but their potential function remains obscure. We measured the Abney effect in a new way--by varying the bandwidth of the spectrum rather than mixing with white--and this leads to a new interpretation of the role of nonlinear responses in color appearance. Because of the eye's limited spectral sensitivity, increasing the bandwidth of a spectrum changes the relative responses in the three classes of cone receptor and thus would change hue if the percept were tied to a fixed cone ratio. However, we found that hue is largely independent of bandwidth and thus constant for a constant peak wavelength for stimuli with Gaussian spectra. This suggests that color appearance is compensated for the eye's spectral filtering, and that this compensation embodies specific perceptual inferences about how natural spectra vary. When a wavelength is instead diluted with white light--which does not bias the cone ratios--then the same compensation predicts changes in hue because the "right" response is made to the "wrong" stimulus. This model generates constant hue loci that are qualitatively consistent with measures of the Abney effect and provides a novel functional account of such effects in color appearance, in which postreceptoral responses are adjusted so that constant hue percepts are tied to consistent physical properties of the environment rather than consistent physiological properties such as the cone ratios.


Figures

Figure 1
Figure 1
The band-pass nature of the eye’s spectral sensitivity biases the response to broadband stimuli relative to narrow spectra. Filtering a narrow spectrum primarily affects the height of the curve (top) while a broader spectrum is changed in shape (middle). To match the relative cone excitation to the narrow stimulus, the peak of the broader spectrum must usually be shifted (bottom).
Figure 2
Figure 2
Predicted hue loci as a function of spectral bandwidth for observers with different spectral sensitivities. Lines plot the settings for the “standard observer” with standard sensitivity. Predictions are based on adjusting the center wavelength to maintain a constant ratio across the cone receptors. Top panels: settings for a blue, green, or yellow assuming all observers choose the same cone ratio for a given hue. Bottom: hue settings assuming instead that observers choose the same broadband environmental stimulus for a given unique hue.
Figure 3
Figure 3
Experimental apparatus. Xe, Xenon lamp; IF, interference wedge; LCD, LCD panel; IS, integrating sphere.
Figure 4
Figure 4
Examples of the stimulus spectra used to measure unique green, and their color coordinates shown in the CIE 1931 chromaticity diagram.
Figure 5
Figure 5
Stimuli selected by individual observers for unique blue, green, and yellow for foveally viewed stimuli. Top panels plot the chromaticities in the CIE diagram. Bottom panels instead plot the stimuli according to the selected center wavelength. Solid and open symbols indicate narrowband and broadband settings, respectively. Dashed lines show settings predicted if no compensation occurs for the bandwidth change, based on the standard observer.
Figure 6
Figure 6
(Top left) Predicted center wavelength for narrowband stimuli matched in hue to a broadband reference (large symbols), assuming a standard observer (solid lines), an observer with no macular pigment (dashed lines), or an observer with a high macular density (1.3 at 460 nm; dotted lines). (Top right) Mean hue matches for seven participants for foveal (filled) and peripheral (open) viewing. Error bars are standard deviations across observers. (Bottom panels) Hue matches for one participant (YM) with a measured peak macular density of 1.3. Solid and open symbols show foveal and peripheral settings, respectively. Error bars are ±1 SD of repeated settings.
Figure 7
Figure 7
(Left) Constant hue loci as a function of bandwidth for the standard observer, assuming no compensation for spectral screening. Complete compensation instead predicts straight lines of constant center wavelength. (Right) Corresponding predictions for the Abney effect, shown in the CIE diagram for comparison with observed measurements. In this case, the stimulus is desaturated by mixing a monochromatic light with an equal-energy white. This produces straight hue lines for a linear model, whereas the curved contours shown are predicted if the visual system instead applies a correction for the purity change that would be appropriate if the desaturated chromaticity resulted from a change in spectral bandwidth. For the extraspectral reds, the predictions were instead generated for inverse Gaussian spectra [with increasing purity modeled by subtracting from a flat spectrum a Gaussian of fixed bandwidth (100 nm) but increasing height]. Solid lines, unfilled symbols: predicted constant hue loci; dotted blue lines, blue symbols: observed constant hue loci replotted from Burns et al. (1984) for one participant (AE); unconnected red and green squares: observed unique red and green settings for the same observer.

References

    1. Abney W. On the changes in hue of spectrum colors by dilution with white light. Proceedings of the Royal Society of London. 1910;82:120–127.
    1. Ayama M, Nakatsue T, Kaiser PK. Constant hue loci of unique and binary hues at 10, 100, and 1000 Td. Journal of the Optical Society of America A. 1987;4:1136–1144. - PubMed
    1. Barlow HB. What causes trichromacy? A theoretical analysis using comb-filtered spectra. Vision Research. 1982;22:635–643. - PubMed
    1. Beer D, Wortman J, Horwitz G, MacLeod D. Compensation of white for macular filtering [Abstract] Journal of Vision. 2005. p. 282a. http://journalofvision.org/5/8/282/ - DOI
    1. Bonnardel V, Bellemare H, Mollon JD. Measurements of human sensitivity to comb-filtered spectra. Vision Research. 1996;36:2713–2720. - PubMed

Publication types