. 2006 Nov 3:6:26.
doi: 10.1186/1471-2229-6-26.

Transcriptome changes in the phenylpropanoid pathway of Glycine max in response to Pseudomonas syringae infection

Affiliations

Transcriptome changes in the phenylpropanoid pathway of Glycine max in response to Pseudomonas syringae infection

Gracia Zabala et al. BMC Plant Biol. .

Abstract

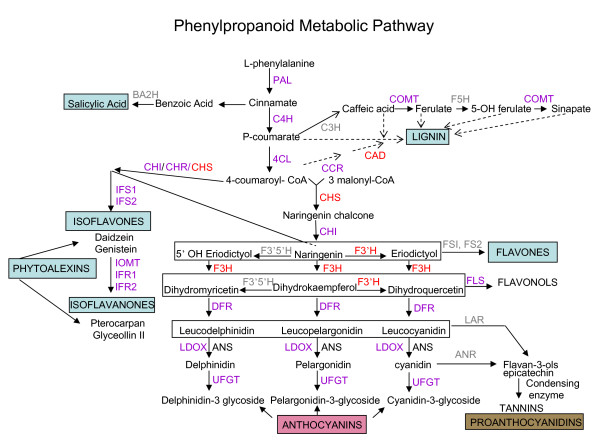
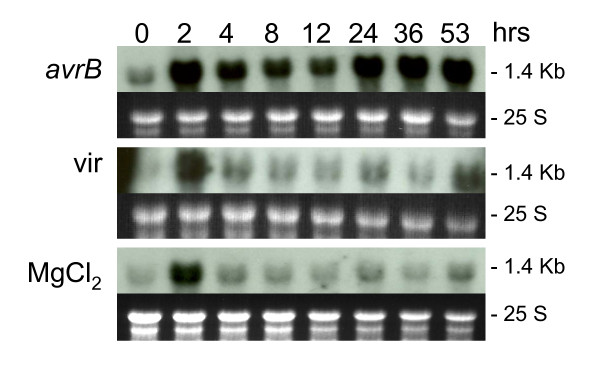
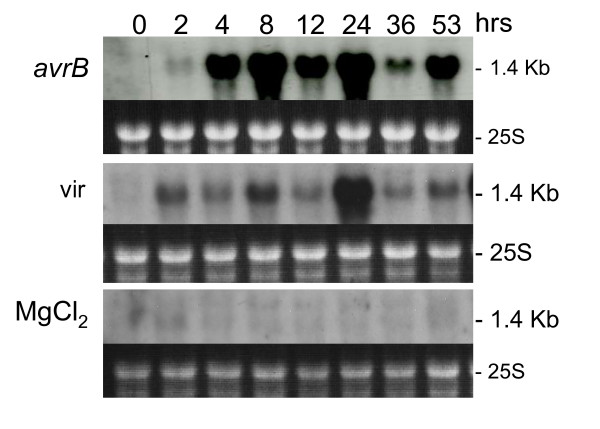
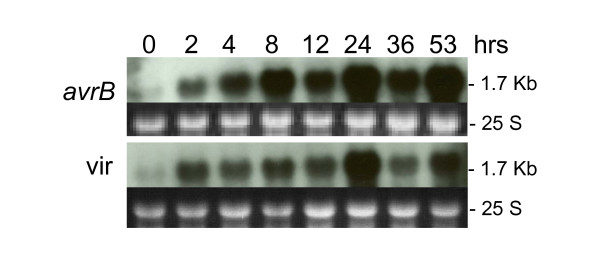
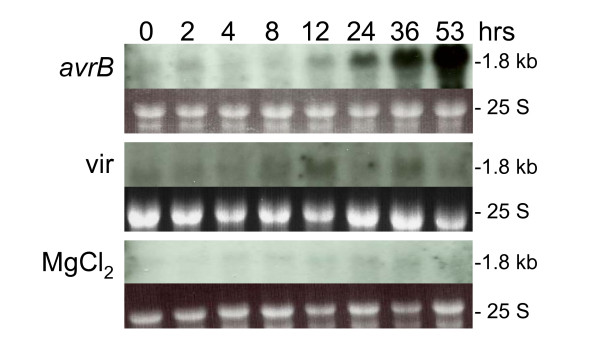
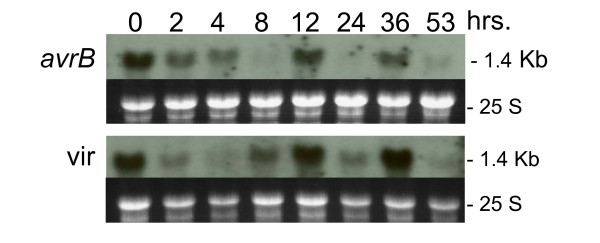
Background: Reports of plant molecular responses to pathogenic infections have pinpointed increases in activity of several genes of the phenylpropanoid pathway leading to the synthesis of lignin and flavonoids. The majority of those findings were derived from single gene studies and more recently from several global gene expression analyses. We undertook a global transcriptional analysis focused on the response of genes of the multiple branches of the phenylpropanoid pathway to infection by the Pseudomonas syringae pv. glycinea with or without the avirulence gene avrB to characterize more broadly the contribution of the multiple branches of the pathway to the resistance response in soybean. Transcript abundance in leaves was determined from analysis of soybean cDNA microarray data and hybridizations to RNA blots with specific gene probes.

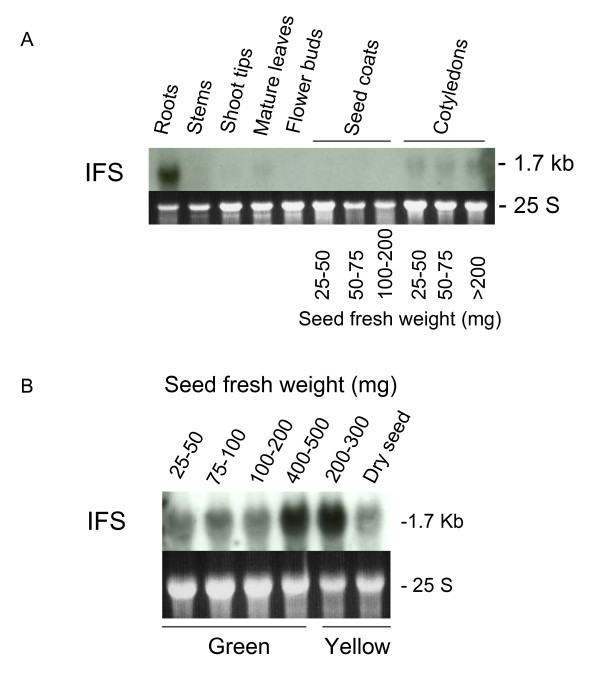
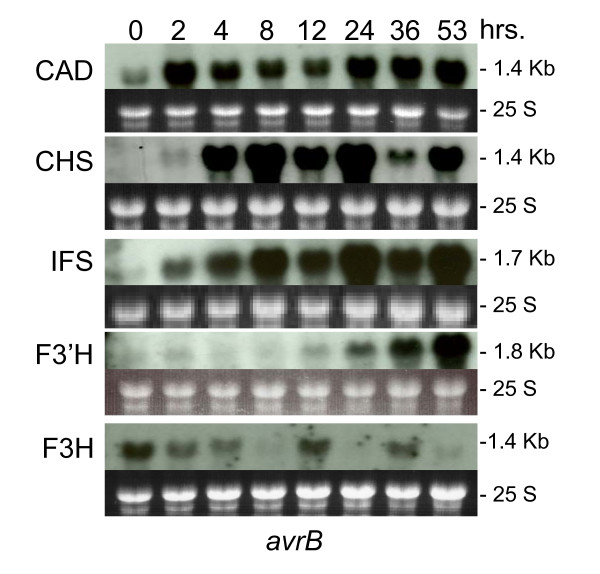
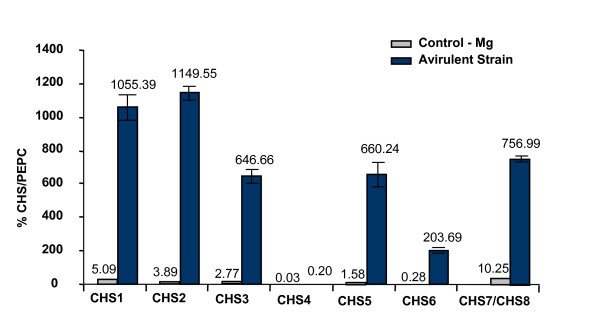
Results: The majority of the genes surveyed presented patterns of increased transcript accumulation. Some increased rapidly, 2 and 4 hours after inoculation, while others started to accumulate slowly by 8-12 hours. In contrast, transcripts of a few genes decreased in abundance 2 hours post inoculation. Most interestingly was the opposite temporal fluctuation in transcript abundance between early responsive genes in defense (CHS and IFS1) and F3H, the gene encoding a pivotal enzyme in the synthesis of anthocyanins, proanthocyanidins and flavonols. F3H transcripts decreased rapidly 2 hours post inoculation and increased during periods when CHS and IFS transcripts decreased. It was also determined that all but one (CHS4) family member genes (CHS1, CHS2, CHS3, CHS5, CHS6 and CHS7/8) accumulated higher transcript levels during the defense response provoked by the avirulent pathogen challenge.

Conclusion: Based on the mRNA profiles, these results show the strong bias that soybean has towards increasing the synthesis of isoflavonoid phytoalexins concomitant with the down regulation of genes required for the synthesis of anthocyanins and proanthocyanins. Although proanthocyanins are known to be toxic compounds, the cells in the soybean leaves seem to be programmed to prioritize the synthesis and accumulation of isoflavonoid and pterocarpan phytoalexins during the resistance response. It was known that CHS transcripts accumulate in great abundance rapidly after inoculation of the soybean plants but our results have demonstrated that all but one (CHS4) member of the gene family member genes accumulated higher transcript levels during the defense response.


Figures

Figure 1
Figure 1
Phenylpropanoid metabolic pathway. Enzymes are indicated in uppercase letters. In purple are the enzymes for which cDNAs were printed in the soybean microarrays and their RNA profiles were determined in the microarray experiments. In red are the enzymes which RNA profiles were measured by microarrays and RNA blots using specific cDNA probes. In gray are enzymes for which no annotated EST exists in soybean public databases. PAL, phenylalanine ammonia-lyase; C4H, cinnamate 4-hydroxylase; 4CL, 4-coumarate: CoA ligase; CHS, chalcone synthase; CHI, chalcone isomerase; IFS, isoflavone synthase; F3'H, flavonoid 3'-hydroxylase; F3', 5'H, flavonoid 3',5'-hydroxylase; F3H, flavanone 3-hydroxylase; DFR, dihydroflavonol-4-reductase; ANS, anthocyanidin synthase also called LDOX, leucoanthocyanidin dioxygenase); UFGT, UDP-flavonoid glucosyltransferase; BA2H, benzoic acid 2-hydroxylase; C3H, p-coumarate 3 hydroxylase; COMT, caffeic O-methyltransferase; F5H, ferulic acid 5-hydroxylase; CCR, cynnamoyl CoA reductase; CAD, cynnamyl alcohol dehydrogenase.
Figure 2
Figure 2
Cynnamyl alcohol dehydrogenase (CAD) RNA (1.4 kb) profile. Measurements made at 8 intervals through a 53 hr period in response to infection by Pseudomonas syringae pv glycinea with avrB (avrB) or without (vir) (First and second panels respectively). Third panel is the CAD RNA profile in response to infiltration with control medium (MgCl2). Dark background sub-panels are the 25 S ribosomal RNAs from corresponding ethidium bromide-stained gels prior to membrane transfer and shown to compare sample loading. Gm-r1030-4089 soybean cDNA clone was used as probe.
Figure 3
Figure 3
Chalcone synthase (CHS) RNA (1.4 kb) profile. Measurements made at 8 intervals through a 53 hr period in response to infection by Pseudomonas syringae pv glycinea with avrB (avrB) or without (vir) (First and second panels respectively). Third panel is the CHS RNA profile in response to infiltration with control medium (MgCl2). Dark background sub-panels are the 25 S ribosomal RNAs from corresponding ethidium bromide-stained gels prior to membrane transfer and shown to compare sample loading. The soybean CHS genomic clone (pC2H2.0, Gm-b10BB-5) was used as probe.
Figure 4
Figure 4
Isoflavone synthase (IFS) tissue-specific expression in Glycine max, cultivar Williams. (A) IFS transcripts (1.7 kb) detected in a RNA blot containing 10 μg of total RNA samples purified from roots, stems, shoot tips, mature leaves, flower buds, seed coats and cotyledons of soybean plants, cv. Williams 82. Seed coats and cotyledons from three different stages of seed development were used. Seed fresh weight in milligrams is shown at bottom. (B) Expression of IFS in the cotyledon of Glycine max, cv. Williams through seed development. The 25 S ribosomal RNAs from the ethidium bromide-stained gel prior to membrane transfer are shown in the dark background sub-panels to compare RNA sample loading. The Gm-c1059-264 soybean cDNA clone was used as probe.
Figure 5
Figure 5
Isoflavone synthase (IFS) RNA (1.7 kb) profile. Measurements made at 8 intervals through a 53 hr period in response to infection by Pseudomonas syringae pv glycinea with avrB (avrB) or without (vir) (First and second panels respectively). Dark background sub-panels are the 25 S ribosomal RNAs from corresponding ethidium bromide-stained gels prior to membrane transfer and shown to compare sample loading. The Gm-c1059-264 soybean cDNA clone was used as probe.
Figure 6
Figure 6
Flavonoid 3'-hydroxylase (F3'H) RNA (1.8 kb) profile. Measurements made at 8 intervals through a 53 hr period in response to infection by Pseudomonas syringae pv glycinea with avrB (avrB) or without (vir) (First and second panels respectively). Third panel is the F3'H RNA profile in response to infiltration with control medium (MgCl2). Dark background sub-panels are the 25 S ribosomal RNAs from corresponding ethidium bromide-stained gels prior to membrane transfer and shown to compare sample loading. Gm-c1019-10961 soybean cDNA clone was used as probe.
Figure 7
Figure 7
Flavanone 3-hydroxylase (F3H) RNA (1.4 kb) profile. Measurements made at 8 intervals through a 53 hr period in response to infection by Pseudomonas syringae pv glycinea with avrB (avrB) or without (vir) (First and second panels respectively). Dark background sub-panels are the 25 S ribosomal RNAs from corresponding ethidium bromide-stained gels prior to membrane transfer and shown to compare sample loading. Gm-c1012-683 soybean cDNA clone was used as probe.
Figure 8
Figure 8
Alignment of CAD, CHS, IFS, F3'H and F3H, RNA gel blot profiles. The alignment of the RNA profiles from previous five figures revealed the opposite fluctuation in RNA accumulation of the F3H RNAs during the plant's response to Pseudomonas syringae pv. glycinea with avrB infection.
Figure 9
Figure 9
Expression profile of the CHS gene family members as determined by TaqMan® RT-PCR. Total RNA from leaves of Glycine max cv. Williams infiltrated with MgCl2 (gray boxes) or the avirulent (black boxes) strains of Pseudomonas syringae pv. glycinea was isolated after eight hours of infection, reverse transcribed and subjected to real-time PCR. Relative amounts were calculated and normalized with respect to PEPC transcript levels (=100%). Data shown represents mean values obtained from three independent amplification reactions and the error bars indicate the S.E. (standard error) of the mean.

References

    1. Cross JE, Kennedy BW, Lambert JW, Cooper RL. Pathogenic races of the bacterial pathogen of soybeans, Pseudomonas glycinea. Plant Disease Report. 1966;50:557–560.
    1. Klement Z. From hypersensitivity defense reaction of plants to pathogens. In: Mount MS, Lacy GH, editor. Phytopathogenic Prokariotes. New York: Academic Press; 1982. pp. 149–177.
    1. Jones AM, Dangl JL. Logjam at the Styx: Programed Cell Death in Plants. Trends in Plant Sciences. 1996;1:114–119. doi: 10.1016/S1360-1385(96)90005-9. - DOI
    1. Quirino BF, Bent AF. Deciphering host resistance and pathogen virulence: the Arabidopsis/Pseudomonas interaction as a model. Mol Plant Pathol. 2003;4:517–530. doi: 10.1046/j.1364-3703.2003.00198.x. - DOI - PubMed
    1. de Wit PJGM. Pathogen avirulence and plant resistance: A key role for recognition. Trends Plant Sci. 1997;2:452–458. doi: 10.1016/S1360-1385(97)01139-4. - DOI

Publication types

MeSH terms

LinkOut - more resources