. 2007 Feb;184(2):185-95.
doi: 10.1016/j.jmr.2006.10.003. Epub 2006 Nov 2.

Practical aspects of (1)H transverse paramagnetic relaxation enhancement measurements on macromolecules

Affiliations

Practical aspects of (1)H transverse paramagnetic relaxation enhancement measurements on macromolecules

Junji Iwahara et al. J Magn Reson. 2007 Feb.

Abstract

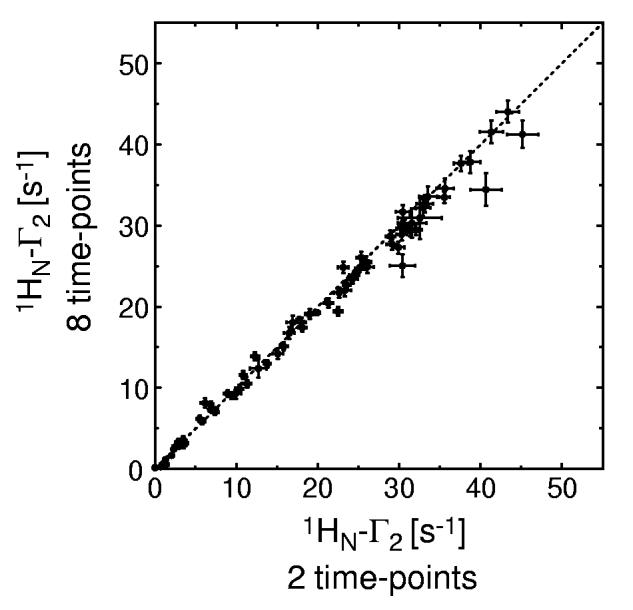
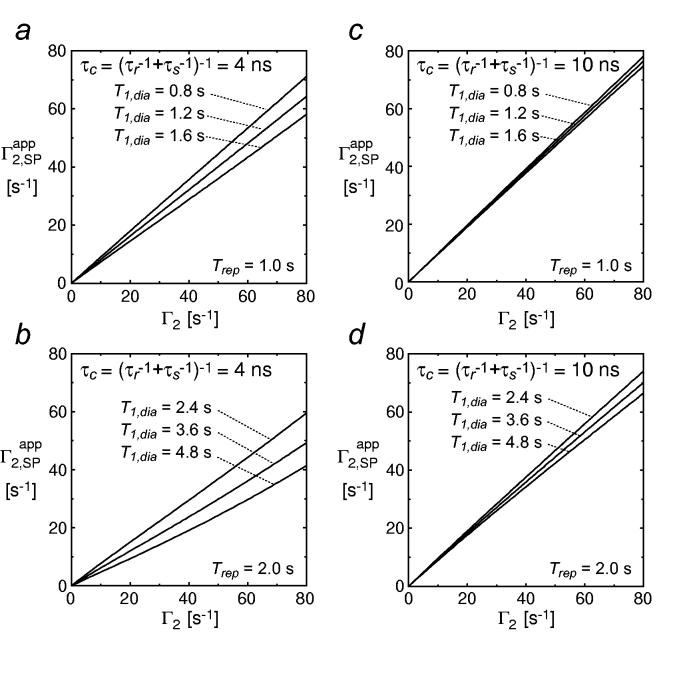
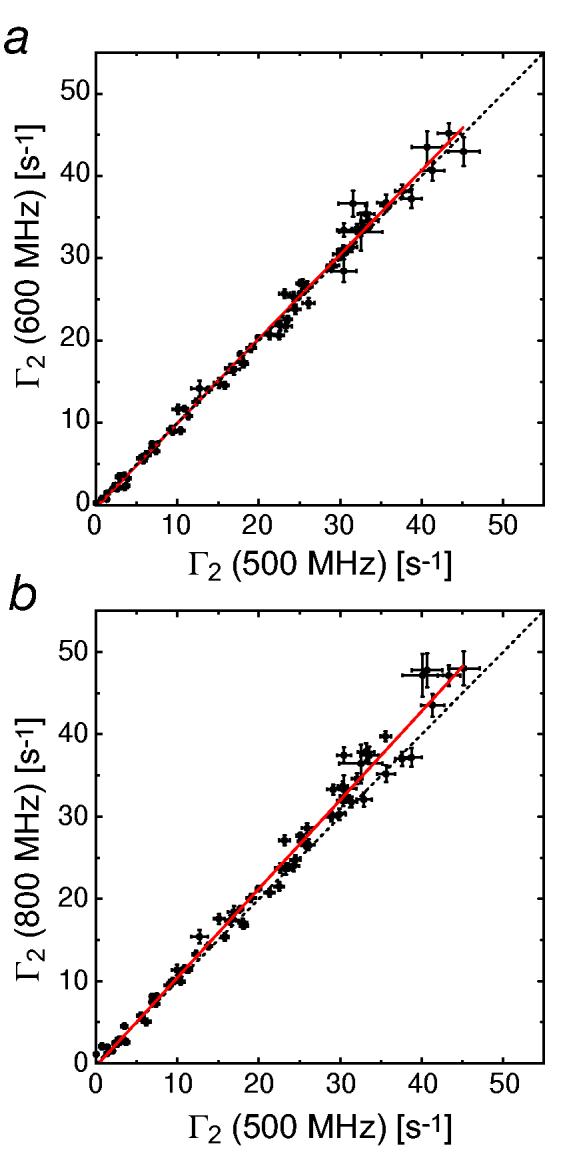
The use of (1)H transverse paramagnetic relaxation enhancement (PRE) has seen a resurgence in recent years as method for providing long-range distance information for structural studies and as a probe of large amplitude motions and lowly populated transient intermediates in macromolecular association. In this paper we discuss various practical aspects pertaining to accurate measurement of PRE (1)H transverse relaxation rates (Gamma(2)). We first show that accurate Gamma(2) rates can be obtained from a two time-point measurement without requiring any fitting procedures or complicated error estimations, and no additional accuracy is achieved from multiple time-point measurements recorded in the same experiment time. Optimal setting of the two time-points that minimize experimental errors is also discussed. Next we show that the simplistic single time-point measurement that has been commonly used in the literature, can substantially underestimate the true value of Gamma(2), unless a relatively long repetition delay is employed. We then examine the field dependence of Gamma(2), and show that Gamma(2) exhibits only a very weak field dependence at high magnetic fields typically employed in macromolecular studies. The theoretical basis for this observation is discussed. Finally, we investigate the impact of contamination of the paramagnetic sample by trace amounts (5%) of the corresponding diamagnetic species on the accuracy of Gamma(2) measurements. Errors in Gamma(2) introduced by such diamagnetic contamination are potentially sizeable, but can be significantly reduced by using a relatively short time interval for the two time-point Gamma(2) measurement.


Figures

Fig. 1
Fig. 1
Pulse sequence for 1HN2 measurements. The delay T is changed for the relaxation measurement. Thin and bold bars indicate rectangular 90° and 180° pulses, respectively. Phases are along x unless indicated otherwise. Short bold bars represent soft rectangular 90° pulses (1.4 ms) selective for the 1H2O resonance. A half-bell shape for 1H represents a half-Gaussian 90° pulse selective for water (2.0 ms). Delays are as follows: τa = 2.7 ms; τb = 2.25 ms; δ = (length of 13C WURST pulse). Phase cycling: ϕ1=(y, y, −y, −y); ϕ2 = (x,−x); ϕ3 = (x,x,−x,−x,y,y,−y,−y); receiver=(x, −x, −x, x, −x, x, x, −x). The receiver phase and ϕ2 were incremented for States-TPPI quadrature detection in the t1 domain. Field gradients are optimized to minimize the solvent signal. Although 3JHN-Hα is active for non-deuterated proteins during the period T, the resulting modulation is cancelled out when Γ2 is calculated as described in the main text.
Fig. 2
Fig. 2
Theoretical relationship between the delay difference ΔT and the error σ(Γ2) in the value of Γ2 obtained from a two time-point measurement (first time point, T = 0; second time point T = ΔT). The error function is given by Eq. 6. The results are shown for Idia(0)/σ(Idia) = 200.0, where Idia(0) is the signal height at T = 0 for the diamagnetic sample, and σ(Idia) is the noise standard deviation. The relationship between Idia(0) and Ipara(0) was assumed to be given by Eq. 7.
Fig. 3
Fig. 3
Correlation between experimentally determined 1HN2 rates derived from two (ΔT = 14 ms) and 8 time-point (ΔT = 2.8 ms) measurements for the 2H/15N-labeled SRY/DNA-EDTA-Mn2+ complex (0.3 mM). 64 scans per FID were acquired for the 2-time-point measurement and 16 scans per FID for the 8-time-point measurement, resulting in the same total measurement time (∼21 hours). Identical measurements were carried out for the paramagnetic (Mn2+) and diamagnetic (Ca2+) states. The data were measured at a 1H-frequency of 500 MHz.
Fig. 4
Fig. 4
Theoretical relationship between the true Γ2 and the apparent Γ2 derived from the single-time-point approach (Γ2,SPapp) at 1H-frequency of 600 MHz, illustrating the effect of neglecting different recovery levels for the paramagnetic and diamagnetic states on the accuracy of 1H-Γ2 rates derived using the single time-point approach. Two different values for the PRE correlation time τc were considered: τc = 4 ns (panels a and b) and τc = 10 ns (panels c and d). Those two τc values correspond to a ∼20-kDa molecule conjugated to EDTA-Mn2+ and a nitroxide spin label, respectively. Results for a non-deuterated protein (T2,dia = 20 ms and T1,dia = 0.8-1.2 s; panels a and c) and the corresponding deuterated protein (T2,dia = 40 ms and T1,dia = 2.4 – 4.8 s; panels b and d) are displayed separately. The repetition delays between scans (Trep) in the HSQC experiments (τ in Eq. 7 is 9.2 ms) were assumed to be 1.0 s for the non-deuterated sample and 2.0 s for the deuterated one.
Fig. 5
Fig. 5
Experimental field-dependence of 1HN2 measured for the 2H/15N-labeled SRY/DNA-EDTA-Mn2+ complex (0.3 mM) at 500 MHz, 600 MHz, 800 MHz. (a) Correlation between 1HN2 rates determined at 500 MHz and 600 MHz. (b) Correlation between 1HN2 rates determined at 500 MHz and 800 MHz. The dotted lines are diagonals. Red solid lines represent linear regressions. Slopes for a and b are 1.024 and 1.078, respectively. 64, 40, and 32 scans per FID were acquired for the data recorded at 500 MHz, 600 MHz and 800 MHz, respectively.
Fig. 6
Fig. 6
Theoretical effect of contamination by an equivalent diamagnetic species in a paramagnetic sample on Γ2 accuracy. The relationship between the true values of Γ2 and the apparent values derived from two time-point measurements (Γ2,TPapp) at different levels of diamagnetic contamination were computed using Eq. 1, 2, 5, 7 and 12 for ΔT values of (a) 6 ms and (b) 18 ms. The curves shown are for contaminant population pd of 0, 1, 2, 3 and 5% as indicated in the panels.
Fig. 7
Fig. 7
Experimental manifestations of diamagnetic contamination. (a) Correlation between experimentally determined Γ2 values measured for 15N-labeled HPr(E32C)-EDTA-Mn2+ using the two time-point approach with ΔT values of 4 and 40 ms (red solid circles with the error bars representing measurement precision). Also shown are the theoretical correlations between apparent Γ2 values calculated for HPr (assuming a Lorenzian lineshape and a diamagnetic 1H-R2 rate of 25 s−1) with ΔT values of 4 and 40 ms in the presence of 3% (blue line) and 5% (green line) diamagnetic species contamination. (b) Comparison of cross-peak intensities of Thr-34 in the diamagnetic (black line) and paramagnetic (red line) states. The right-hand panel is plotted a ten times the magnification level of the left-hand panel. The peak intensity of the paramagnetic state measured for HPr(E32C)-Cys-EDTA-Mn2+ is ∼3.5% of that in the diamagnetic control. As the amide proton of Thr-34 is in close proximity to the paramagnetic center (< 8 Å), the peak should be broadened beyond detection in the paramagnetic state in the complete absence of diamagnetic contamination.

References

    1. Solomon I. Relaxation processes in a system of two spins. Phys. Rev. 1955;99:559–565.
    1. Boisbouvier J, Gans P, Blackledge M, Brutscher B, Marion D. Long-range structural information in NMR studies of paramagnetic molecules from electron spin-nuclear spin cross-correlated relaxation. J. Am. Chem. Soc. 1999;121:7700–7701.
    1. Pintacuda G, Kaikkonen A, Otting G. Modulation of the distance dependence of paramagnetic relaxation enhancements by CSA×DSA cross relaxation. J. Magn. Reson. 2005;171:233–243. - PubMed
    1. Kosen PA. Spin labeling of proteins. Methods Enzymol. 1989;177:86–121. - PubMed
    1. Gillespie JR, Shortle D. Characterization of long-range structure in the denatured state of staphylococcal nuclease. I. Paramagnetic relaxation enhancement by nitroxide spin labels. J. Mol. Biol. 1997;268:158–169. - PubMed

Publication types

LinkOut - more resources