. 2007 Feb 1;92(3):1022-34.
doi: 10.1529/biophysj.106.089649. Epub 2006 Nov 3.

Analysis of two-dimensional dissociation constant of laterally mobile cell adhesion molecules

Affiliations

Analysis of two-dimensional dissociation constant of laterally mobile cell adhesion molecules

De-Min Zhu et al. Biophys J. .

Abstract

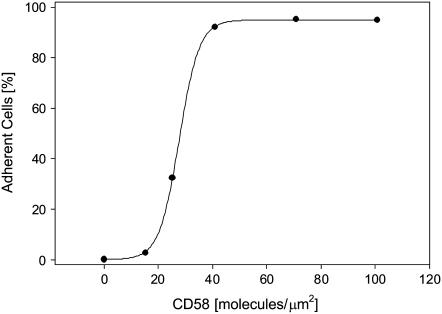
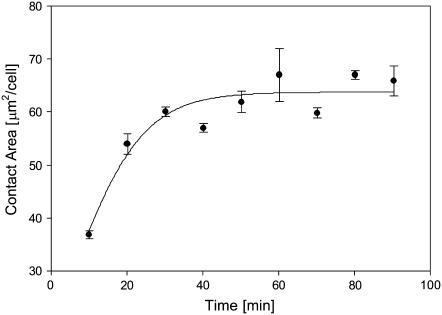
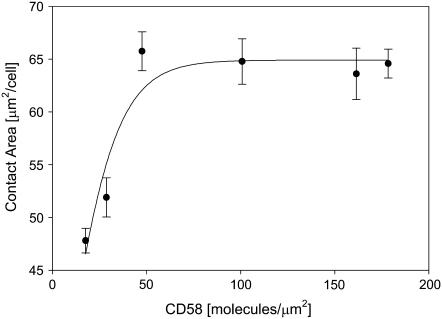
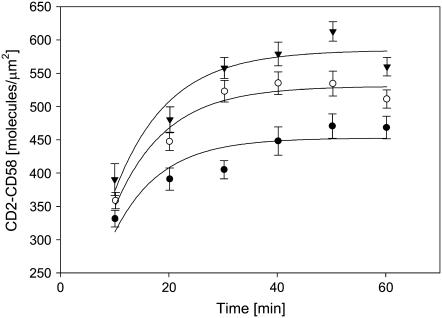
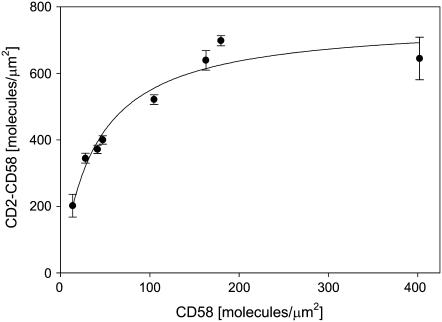
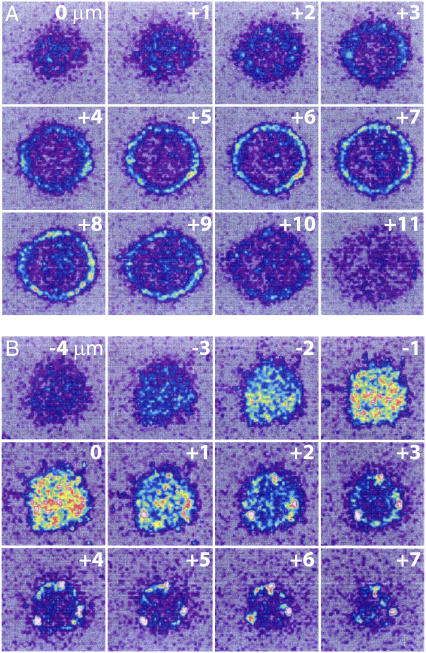
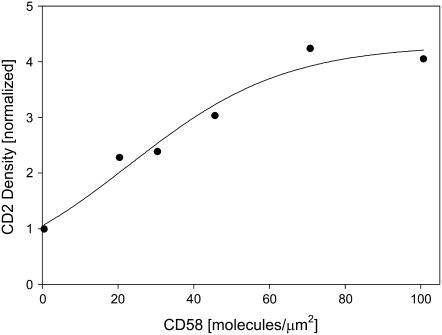
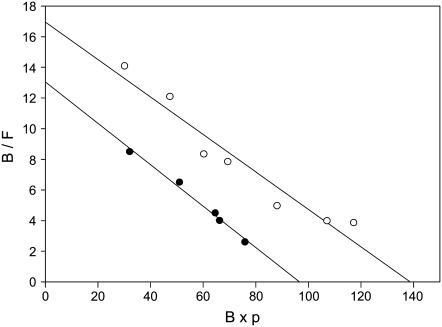
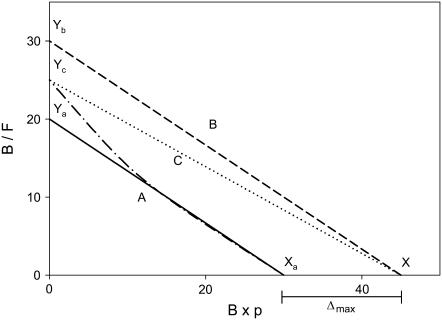
We formulate a general analysis to determine the two-dimensional dissociation constant (2D Kd), and use this method to study the interaction of CD2-expressing T cells with glass-supported planar bilayers containing fluorescently labeled CD58, a CD2 counter-receptor. Both CD2 and CD58 are laterally mobile in their respective membranes. Adhesion is indicated by accumulation of CD2 and CD58 in the cell-bilayer contact area; adhesion molecule density and contact area size attain equilibrium within 40 min. The standard (Scatchard) analysis of solution-phase binding is not applicable to the case of laterally mobile adhesion molecules due to the dynamic nature of the interaction. We derive a new binding equation, B/F=[(Ntxf)/(KdxScell)]-[(Bxp)/Kd], where B and F are bound and free CD58 density in the contact area, respectively; Nt is CD2 molecule number per cell; f is CD2 fractional mobility; Scell is cell surface area; and p is the ratio of contact area at equilibrium to Scell. We use this analysis to determine that the 2D Kd for CD2-CD58 is 5.4-7.6 molecules/microm2. 2D Kd analysis provides a general and quantitative measure of the mechanisms regulating cell-cell adhesion.


Figures

FIGURE 1
FIGURE 1
Jurkat T cell adhesion to CD58-containing bilayer, as a function of the initial density of CD58 in the bilayer. Adherent and nonadherent cells were scored as described in the text; at least 100 cells were used for each data point. A threshold density of ∼20 molecules/μm2 was required to support cell adhesion.
FIGURE 2
FIGURE 2
Development of the cell-bilayer contact area as a function of incubation time. Jurkat T cells were incubated with bilayers containing FITC-CD58 at a density of 100 molecules/μm2. The size of the contact area was determined as described in the text; 30–100 cells were used for each data point. Data points represent mean ± SE.
FIGURE 3
FIGURE 3
Size of the contact area as a function of initial CD58 density in the bilayer. Jurkat T cells were incubated for 40 min with bilayers containing different densities of FITC-CD58, and then contact area size was determined as described in the text; 30–170 cells were used for each data point. Data points represent mean ± SD. At initial CD58 densities <20 molecules/μm2, cells were not adherent to the bilayer.
FIGURE 4
FIGURE 4
Time course of accumulation of bound CD58 molecules in the contact area. The initial densities of CD58 in the bilayer were 24 (solid circles), 50 (open circles), and 74 (solid triangles) molecules/μm2, respectively. Bound CD58 molecules were quantified as described in the text; 20–64 cells were used for each data point. Data points represent mean ± SD.
FIGURE 5
FIGURE 5
Steady-state accumulation of bound CD58 molecules in the contact area as a function of initial CD58 density in the bilayer. Jurkat T cells were incubated for 40 min with bilayers containing different densities of FITC-CD58, and then the density of bound CD2-CD58 complexes was determined as described in the text. At least 50 cells were used for each data point. Data points represent mean ± SD.
FIGURE 6
FIGURE 6
Confocal images of CD2 distribution on the surface of Jurkat T cells. CD2 molecules were labeled using FITC-CD2.1, a fluorescent derivative of the nonblocking anti-CD2 mAb CD2.1. Cells were then incubated with an egg PC bilayer (A) or with an egg PC bilayer that had been reconstituted with 150 molecules/μm2 of unlabeled (i.e., nonfluorescent) CD58 (B). Confocal microscopy was used to image sections in 1-μm steps progressing from the bottom to the top of the cell, beginning from the glass surface (A) or from 4 μm below the bottom of the cell (B); z values are indicated relative to the plane of the coverslip in the upper right corner of each section. There was no accumulation of CD2 at the area of contact with bilayers lacking CD58 ((A), 0 to +3 μm), but cells interacting with bilayers containing CD58 showed significant redistribution of CD2 to the contact area ((B), −2 to +1 μm).
FIGURE 7
FIGURE 7
Steady-state accumulation of CD2 molecules in the contact area as a function of initial CD58 density in the bilayer. Jurkat T cells were labeled with FITC-CD2.1, and then incubated for 40 min with bilayers containing different densities of CD58. CD2 accumulation in the contact area was determined as described in the text; 20–130 cells were used for each data point. CD2 density in the contact area was normalized to the average CD2 density on the surface of Jurkat cells; according to the data in Table 2, this value was ∼136,000 molecules/cell ÷ 700 μm2, or 190 molecules/μm2.
FIGURE 8
FIGURE 8
Representative Zhu-Golan (B/F vs. B × p) plots (Eq. 10) describing interactions of Jurkat T cells (open circles) and peripheral blood T cells (solid circles) with bilayers containing CD58. Cells were incubated for 40 min with bilayers containing different densities of FITC-CD58. The densities of bound (B) and free (F) CD58 in the contact area, and the ratio of contact area size to surface area of the cell (p), were then determined as described in the text. Each point represents data from 27 to 176 cells. Curves were analyzed to determine the 2D Kd for the CD2-CD58 binding interaction and the total number (Nt) of CD2 molecules on the T cell surface. For Jurkat T cells, 2D Kd was 8.1 molecules/μm2 (r2 = 0.97) and Nt was 130,000 molecules. For peripheral blood T cells, 2D Kd was 7.4 molecules/μm2 (r2 = 0.99) and Nt was 36,000 molecules.
FIGURE 9
FIGURE 9
Range of deviation in the B/F vs. B × p plot caused by using (B × p) to approximate (BM × p + BI). Line A is the linearized approximate plot of B/F vs. B × p, with an x-intercept of Xa and a y-intercept of Ya. (The dotted line shows the plot before linearization.) Line B is an imaginary line parallel to Line A, separated from Line A by Δmax in the x direction. Line C is the imaginary ideal plot of B/F vs. (BM × p + BI). Lines B and C share the same x-intercept, X. Yb and Yc are the y-intercepts of Lines B and C, respectively.

References

    1. Dustin, M. L., S. K. Bromley, M. M. Davis, and C. Zhu. 2001. Identification of self through two-dimensional chemistry and synapses. Annu. Rev. Cell Dev. Biol. 17:133–157. - PubMed
    1. Davis, S. J., S. Ikemizu, M. K. Wild, and P. A. van der Merwe. 1998. CD2 and the nature of protein interactions mediating cell-cell recognition. Immunol. Rev. 163:217–236. - PubMed
    1. Tangye, S. G., J. H. Phillips, and L. L. Lanier. 2000. The CD2-subset of the Ig superfamily of cell surface molecules: receptor-ligand pairs expressed by NK cells and other immune cells. Semin. Immunol. 12:149–157. - PubMed
    1. Doyle, C., and J. L. Strominger. 1987. Interaction between CD4 and class-II MHC molecules mediates cell-adhesion. Nature. 330:256–259. - PubMed
    1. Luescher, I. F., E. Vivier, A. Layer, J. Mahiou, F. Godeau, B. Malissen, and P. Romero. 1995. CD8 modulation of T-cell antigen receptor-ligand interactions on living cytotoxic T-lymphocytes. Nature. 373:353–356. - PubMed

Publication types