. 2007 Feb 1;92(3):787-97.
doi: 10.1529/biophysj.106.082321. Epub 2006 Nov 3.

Adhesive dynamics simulations of the shear threshold effect for leukocytes

Affiliations

Adhesive dynamics simulations of the shear threshold effect for leukocytes

Kelly E Caputo et al. Biophys J. .

Abstract

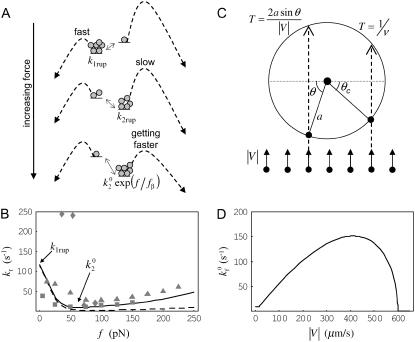
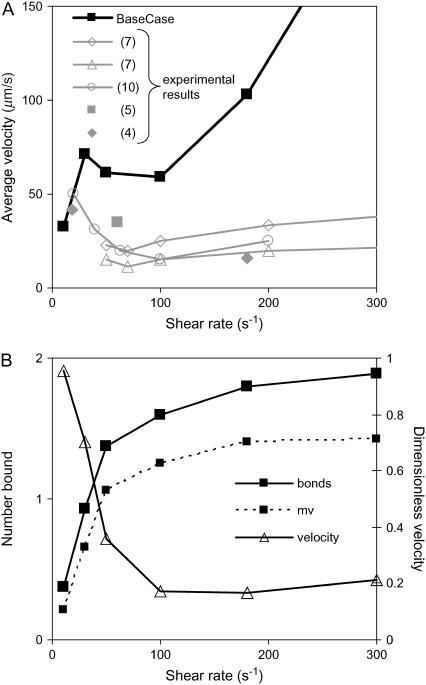
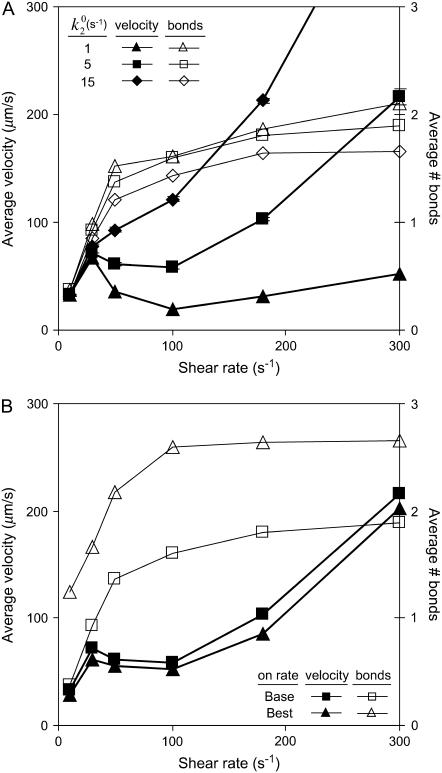
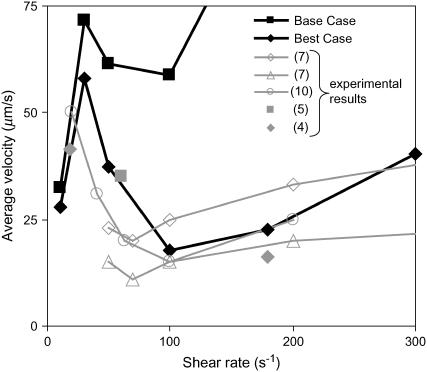
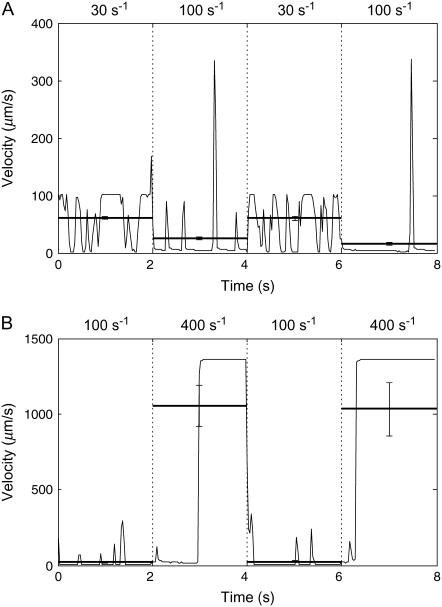
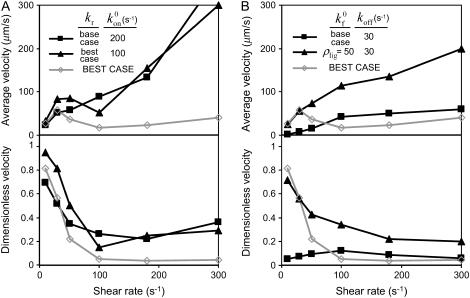
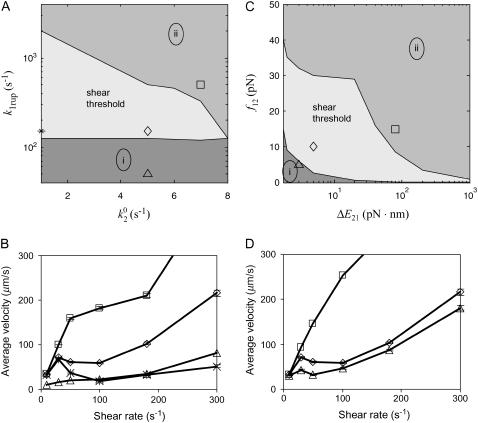
Many experiments have measured the effect of force on the dissociation of single selectin bonds, but it is not yet clear how the force dependence of molecular dissociation can influence the rolling of cells expressing selectin molecules. Recent experiments using constant-force atomic force microscopy or high-resolution microscopic observations of pause-time distributions of cells in a flow chamber show that for some bonds, the dissociation rate is high at low force and initially decreases with force, indicating a catch bond. As the force continues to increase, the dissociation rate increases again, like a slip bond. It has been proposed that this catch-slip bond leads to the shear threshold effect, in which a certain level of shear rate is required to achieve rolling. We have incorporated a catch-slip dissociation rate into adhesive dynamics simulations of cell rolling. Using a relatively simple model for the shear-controlled association rate for selectin bonds, we were able to recreate characteristics of the shear threshold effect seen most prominently for rolling through L-selectin. The rolling velocity as a function of shear rate showed a minimum near 100 s-1. Furthermore, cells were observed to roll at a shear rate near the threshold, but detach and move more quickly when the shear rate was dropped below the threshold. Finally, using adhesive dynamics, we were able to determine ranges of parameters necessary to see the shear threshold effect in the rolling velocity. In summary, we found through simulation that the catch-slip behavior of selectin bonds can be responsible for the shear threshold effect.


Figures

FIGURE 1
FIGURE 1
Receptor-ligand reaction rates. (A) Depiction of Evans' two-state model for bond dissociation. Bonds can exist in two states. At low forces, state 1 is likely populated and breakage via this state is fast with constant rate k1rup. As the force on the bond increases, state 2 becomes more likely. Breakage via state 2 is slower with rate k2rup, which increases with force according to the Bell model. (B) Base-case and best-case (dashed line) catch-slip off rates as a function of force. Evans' model parameters were chosen as given in Table 1 to correspond to experimental L-selectin off-rate data. The parameters k1rup and formula image strongly influence the high off rate at low forces and the low off rate at intermediate forces, respectively. Experimental off rates are for L-selectin/PSGL-1 bonds measured by AFM (▪) (9), neutrophils on sparse sPSGL-1 in a flow chamber (▴) (10), and L-selectin-expressing lymphocytes on PSGL-1-derived peptides in a flow chamber (♦) (14). (C) Schematic for shear-controlled on-rate derivation. A molecule of interest is shown with its reactive circle of radius a. A uniform distribution of molecules on the apposing surface approaches the circle with relative velocity |V|. The time T spent in the reactive circle depends on the angle of the entry point, θ. At angles formula image, the molecules are in binding proximity less than the required amount of time, 1/ν, so the probability of those molecules binding is zero. (D) Base-case shear-controlled on rate with parameters given in Table 1. The unstressed on rate increases with relative velocity between surfaces, but then drops to zero when molecules pass by each other too quickly to bind.
FIGURE 2
FIGURE 2
Base-case results for L-selectin-mediated rolling. (A) Average velocity as a function of shear rate. The base-case simulation shows a minimum in velocity near 100 s−1, similar to experimental results. Experiments are from Puri et al. (7), lymphocytes on CD34 at 50 or 300 sites/μm2; Yago et al. (10), neutrophils on sPSGL-1 at 140 sites/μm2; Lawrence et al. (5) and Finger et al. (4), T-cells on PNAd. (B) Number of bonds and bound microvilli. Also, average velocity normalized by hydrodynamic velocity. The dimensionless velocity decreases with shear rate whereas the number of bonds increases.
FIGURE 3
FIGURE 3
Average velocity and number of bonds versus shear rate for explorations of rate parameters. (A) Various values of the unstressed off rate (formula image). The remaining parameters are from the base case. This parameter, formula image, influences the velocity at intermediate values of shear rate. (B) Different on rates. Results for the base-case on rate are compared to results for the best-case on-rate parameter values D = 0.15 μm/s2, a = 0.002 μm, and ν = 1.5 × 10⁵ s−1, which give a larger rate in the diffusion limit but a smaller rate in the convective limit. The remaining parameters are from the base case. The modified on rate generates more intimate binding to the surface while maintaining rolling velocities similar to the base case.
FIGURE 4
FIGURE 4
Average velocity versus shear rate. For the best case, formula image so the off rate is smaller at higher forces. As described in the text, the best-case parameters involve lowering formula image by a factor of 5 relative to the base case, but provide a better match to experimental results (listed in Fig. 2) than the base case does.
FIGURE 5
FIGURE 5
Average and instantaneous velocities during jumps in shear rate. Average velocities were calculated over each 2-s period of constant shear rate and are shown as horizontal lines with the standard error. The instantaneous velocity of a representative cell is also shown over the course of an entire 8-s simulation. (A) The shear rate is changed every 2 s between 30 s−1 and 100 s−1 as indicated in the figure. At 30 s−1, below the threshold shear rate, cells travel near hydrodynamic velocity with only a few brief attachments for an average velocity of ∼61 μm/s. On the other hand, cells roll slowly (∼20 μm/s) at 100 s−1 with only a few spikes in velocity. (B) The shear rate is changed every 2 s between 100 s−1 and 400 s−1 as indicated in the figure. Cells bind and travel slowly with a few spikes in velocity as they roll at 100 s−1. Upon the increase in shear rate to 400 s−1, some cells momentarily maintain bonds and a slow rolling velocity before detaching to the free stream. Therefore, the average velocity at 400 s−1 is below hydrodynamic velocity.
FIGURE 6
FIGURE 6
Alternative rate combinations. In each panel, the best case, with a catch-slip off rate and shear-controlled on rate, is shown in gray as a reference. (A) Catch-slip off rate with a constant on rate. Average velocities versus shear rate for representative parameters are shown in the upper panel. With the base-case off-rate parameters, there is no dip in velocity, but when the best-case off-rate is used, a minimum becomes apparent. The corresponding dimensionless velocities are shown in the lower panel. There is a significant decrease in dimensionless velocity even with a constant on rate. (B) Shear-controlled on rate with a constant off rate. Average velocities versus shear rate for representative parameters are shown in the upper panel. Neither the base-case on-rate parameters nor an adjusted on rate with half of the base-case ligand density gives a minimum in velocity. The corresponding dimensionless velocities are given in the lower panel. The dimensionless velocity does not monotonically decrease with shear rate for the base-case on rate. With an adjusted on rate, however, the dimensionless velocity does decrease with shear rate, though not sharply, and there is no minimum in velocity.
FIGURE 7
FIGURE 7
State diagrams for the shear threshold effect in the space of selected catch-slip bond parameters. Other parameters are base case. In region (i), cells travel at <90% Vh at low shear rates. In region (ii), cells do not achieve a minimum in velocity. (A) State-wise off rate parameter space. When k1rup is too small, cells bind and roll even at very low shear rates. When k1rup is too large, cells do not reach a minimum in velocity. The smaller formula image is, however, the larger k1rup can be and still achieve the minimum in velocity. The shear threshold effect can never occur when formula image is too large because cells will not bind well enough to achieve a minimum in velocity. (B) Average velocity as a function of shear rate. An example from each region of the state diagram is shown, with parameters given by the corresponding symbols in A. (C) Transition parameter space. When f12 is too small, cells roll at low shear rates since the system quickly switches to the slow pathway. When f12 is too large, on the other hand, the switch to the slow pathway occurs at too high a force, so that cells cannot roll slowly enough to achieve a minimum in velocity. (D) Average velocity as a function of shear rate. An example from each region of the state diagram is shown with parameters given by the corresponding symbols in C.

References

    1. Alberts, B. 2002. Molecular Biology of the Cell. Garland Science, New York.
    1. Chen, S., and T. A. Springer. 1999. An automatic braking system that stabilizes leukocyte rolling by an increase in selectin bond number with shear. J. Cell Biol. 144:185–200. - PMC - PubMed
    1. Simon, S. I., and C. E. Green. 2005. Molecular mechanics and dynamics of leukocyte recruitment during inflammation. Annu. Rev. Biomed. Eng. 7:151–185. - PubMed
    1. Finger, E. B., K. D. Puri, R. Alon, M. B. Lawrence, U. H. von Andrian, and T. A. Springer. 1996. Adhesion through L-selectin requires a threshold hydrodynamic shear. Nature. 379:266–269. - PubMed
    1. Lawrence, M. B., G. S. Kansas, E. J. Kunkel, and K. Ley. 1997. Threshold levels of fluid shear promote leukocyte adhesion through selectins (CD62L,P,E). J. Cell Biol. 136:717–727. - PMC - PubMed