. 2007 Jan;143(1):263-77.
doi: 10.1104/pp.106.088609. Epub 2006 Nov 3.

Manganese deficiency in Chlamydomonas results in loss of photosystem II and MnSOD function, sensitivity to peroxides, and secondary phosphorus and iron deficiency

Affiliations

Manganese deficiency in Chlamydomonas results in loss of photosystem II and MnSOD function, sensitivity to peroxides, and secondary phosphorus and iron deficiency

Michael D Allen et al. Plant Physiol. 2007 Jan.

Abstract

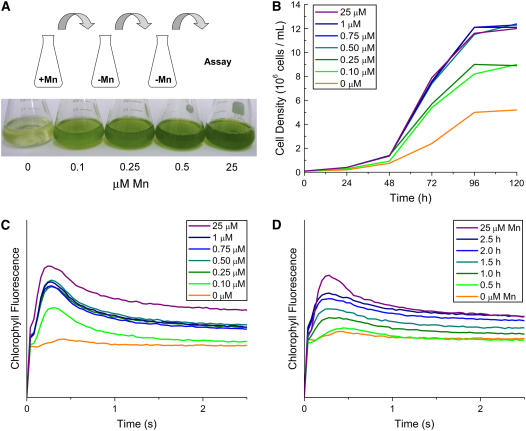
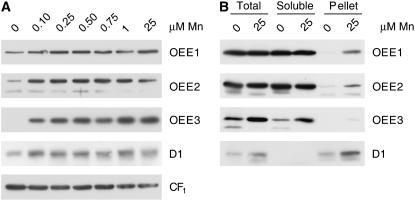
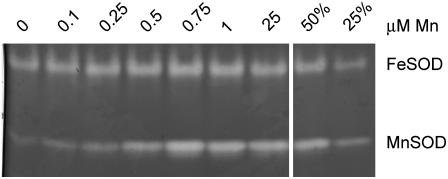
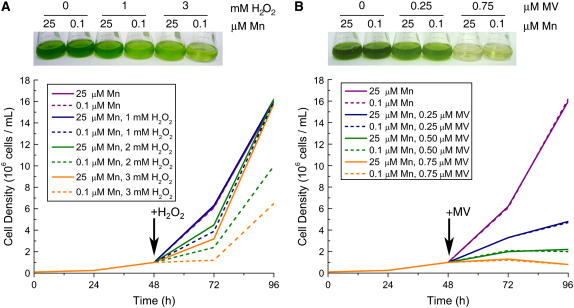
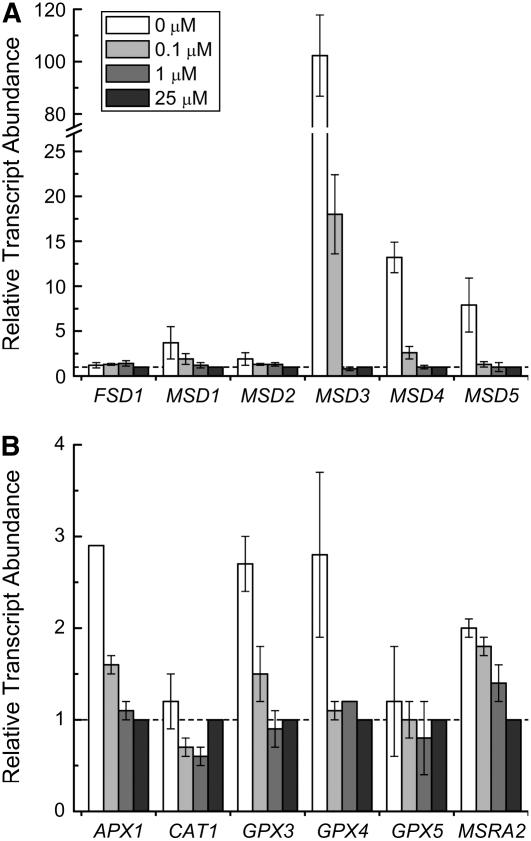
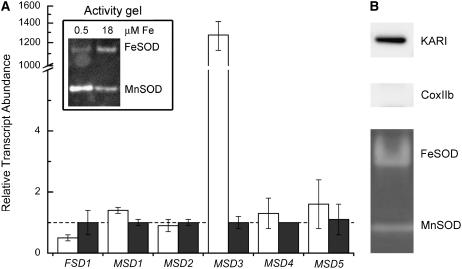
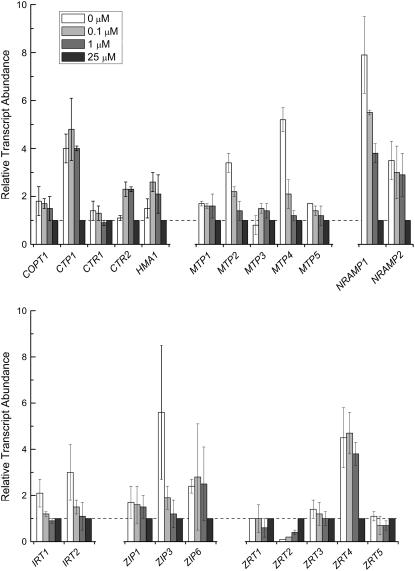
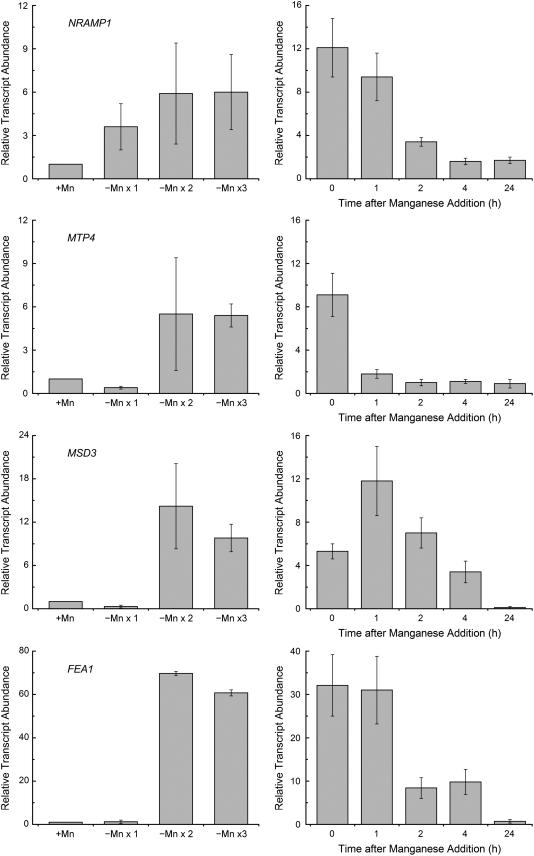
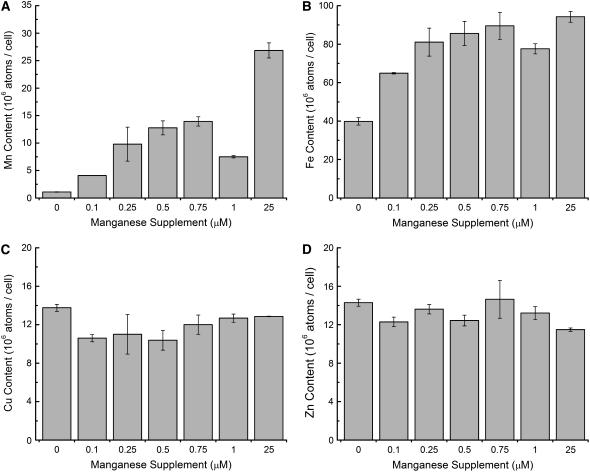
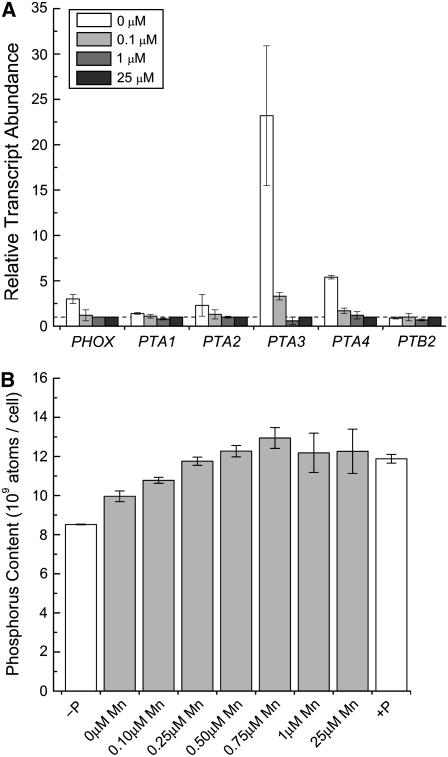
For photoheterotrophic growth, a Chlamydomonas reinhardtii cell requires at least 1.7 x 10(7) manganese ions in the medium. At lower manganese ion concentrations (typically <0.5 microm), cells divide more slowly, accumulate less chlorophyll, and the culture reaches stationary phase at lower cell density. Below 0.1 microm supplemental manganese ion in the medium, the cells are photosynthetically defective. This is accompanied by decreased abundance of D1, which binds the Mn(4)Ca cluster, and release of the OEE proteins from the membrane. Assay of Mn superoxide dismutase (MnSOD) indicates loss of activity of two isozymes in proportion to the Mn deficiency. The expression of MSD3 through MSD5, encoding various isoforms of the MnSODs, is up-regulated severalfold in Mn-deficient cells, but neither expression nor activity of the plastid Fe-containing superoxide dismutase is changed, which contrasts with the dramatically increased MSD3 expression and plastid MnSOD activity in Fe-deficient cells. Mn-deficient cells are selectively sensitive to peroxide but not methyl viologen or Rose Bengal, and GPXs, APX, and MSRA2 genes (encoding glutathione peroxidase, ascorbate peroxidase, and methionine sulfoxide reductase 2) are slightly up-regulated. Elemental analysis indicates that the Mn, Fe, and P contents of cells in the Mn-deficient cultures were reduced in proportion to the deficiency. A natural resistance-associated macrophage protein homolog and one of five metal tolerance proteins were induced in Mn-deficient cells but not in Fe-deficient cells, suggesting that the corresponding gene products may be components of a Mn(2+)-selective assimilation pathway.


Figures

Figure 1.
Figure 1.
Manganese is required for photosynthetic electron transfer and growth of Chlamydomonas. Cells adapted to Mn deficiency (see “Materials and Methods”) were transferred to TAP medium containing the indicated amounts of supplemental manganese and grown photoheterotrophically. A, The visual phenotype of Mn deficiency is shown after 3 d growth. B, Growth was measured by counting cells every 24 h with a hemocytometer. C, Room temperature chlorophyll fluorescence induction kinetics of cells grown (96 h) at the indicated manganese concentration. D, Restoration of fluorescence induction was monitored as a function of time after addition of 25 μm manganese to a Mn-deficient culture (0 μm). The pattern from a Mn-replete culture is shown for comparison (25 μm). All experiments were performed in experimental duplicate in strain CC425 and verified in strain CC1021.
Figure 2.
Figure 2.
Loss of the OEE complex in Mn-deficient cells. A, Thirty micrograms of total membrane protein was loaded onto a denaturing polyacrylamide gel and PSII proteins D1, OEE1, OEE2, and OEE3 (PsbO, P, and Q, respectively) were analyzed for abundance in extracts of cells grown in medium with the indicated manganese concentrations. The α- and β-subunits of CF1 (chloroplast ATP synthase) are used as a loading control. The experiment shown is representative of three independent experiments. B, Total cell extract from Mn deficient (0 μm) or Mn replete (25 μm) was separated into soluble and pellet fractions (see “Materials and Methods”). The sum of the soluble and pellet fraction equals total cell extract. Samples were analyzed as for part A. The experiment shown is representative of two independent fractionations.
Figure 3.
Figure 3.
Loss of MnSOD activity in Mn-deficient cells. Twenty micrograms of total soluble protein was loaded onto a nondenaturing polyacrylamide gel and analyzed for SOD activity in extracts of cells grown in medium with the indicated manganese concentrations. Two- and 4-fold dilutions of the 25-μm sample are included for relative activity comparison. All experiments were performed in experimental triplicate.
Figure 4.
Figure 4.
Selective sensitivity of Mn-deficient cells to H2O2. Cells were grown in 0.1-μm supplemental Mn or 25-μm Mn conditions for 2 d. The growth rate of cells in 0.1 μm supplemental Mn is similar to that of cells grown with 25 μm Mn. Cultures were diluted to 1 × 10⁶ cells/mL before the addition of the indicated concentrations of H2O2 (A) or methyl viologen (MV; B). Growth was monitored by counting cells in a hemocytometer (bottom). Cultures were photographed 24 (H2O2) and 48 (MV) h after exposure to the chemical (top). A duplicate experiment is shown in Supplemental Figure S3.
Figure 5.
Figure 5.
Relative expression of oxidative stress response genes. RNA was isolated from cells grown in TAP medium containing the indicated manganese supplement plus excess Fe (50 μm). Relative expression was normalized to CβLP expression, and average CT value was calculated from technical triplicates. The error bars represent variation from biological duplicates. Expression was calculated by the 2−ΔΔCT method. All experiments were performed in experimental duplicate and also at two different concentrations of iron (18 and 50 μm).
Figure 6.
Figure 6.
MnSOD is up-regulated by Fe deficiency. A, Protein and RNA were isolated from cells grown in 0.5 μm (white bars) or 18 μm (gray bars) iron. Gene expression was assessed by real-time PCR as described in the legend to Figure 5, except that the error bars represent the variation in technical triplicates of the PCR reactions. An independent experiment is shown in Supplemental Figure S3. Inset, Twenty micrograms total protein was loaded onto a nondenaturing polyacrylamide gel and SOD activity was analyzed. All experiments were performed in experimental duplicate in strain CC425 and verified in strain CC1021. B, Chloroplasts were isolated from strain CC400 as described in “Materials and Methods.” Samples (20 μg) were loaded onto a denaturing gel, fractions were tested for purity by immunoblotting with compartment-specific markers (keto-acid reductase isomerase [KARI] for the chloroplast, CoxIIb for the mitochondrion). SOD activity was assessed as in Figure 3, except that 40 μg of soluble protein was loaded on the gel.
Figure 7.
Figure 7.
Relative expression of genes encoding candidate manganese transporters. RNA was isolated from cells grown in TAP medium containing the indicated amounts of manganese supplement plus excess Fe (50 μm). Gene expression was assessed by real-time PCR as described in the legend to Figure 5. Genes encoding transporters of the CTR family (COPT1, CTR1, and CTR2), HMA family (CTP2 and HMA1), cation diffusion facilitator family (MTP1-MTP5), Nramp family (NRAMP1 and NRAMP2), and ZIP family (IRT1, IRT2, ZIP1, ZIP3, ZIP6, and ZRT1-ZRT5) were identified in the Chlamydomonas draft genome by sequence homology. All experiments were performed in experimental duplicate in 18 and 50 μm Fe.
Figure 8.
Figure 8.
(Legend appears on following page.)
Figure 9.
Figure 9.
Intracellular metal content. Cells were grown in medium supplemented with Mn2+ to the indicated concentration, and total Mn (A), Fe (B), Cu (C), and Zn (D) content was measured by inductively coupled plasma-mass spectrometry (see “Materials and Methods”). All experiments were performed in biological duplicate.
Figure 10.
Figure 10.
Mn-deficient cells are phosphorus deficient. A, RNA was isolated from cells grown in TAP medium containing the indicated amounts of Mn2+ supplement. Gene expression was assessed by real-time PCR as described in the legend to Figure 5. The results shown are representative of experimental duplicates. The iron content of the medium (18 and 50 μm) had no impact on the result. B, Phosphorus accumulation was measured by inductively coupled plasma-atomic emission spectroscopy (see “Materials and Methods”) during Mn deficiency (gray bars). Phosphorus-starved (for 24 h) and -replete cultures are included as controls (white bars). Experiments were performed in biological duplicate in strain CC425 and verified in strain CC1021.

Similar articles

Cited by

References

    1. Bartsevich VV, Pakrasi HB (1995) Molecular identification of an ABC transporter complex for manganese: analysis of a cyanobacterial mutant strain impaired in the photosynthetic oxygen evolution process. EMBO J 14 1845–1853 - PMC - PubMed
    1. Beauchamp C, Fridovich I (1971) Superoxide dismutase: improved assays and an assay applicable to acrylamide gels. Anal Biochem 44 276–287 - PubMed
    1. Belouchi A, Kwan T, Gros P (1997) Cloning and characterization of the OsNramp family from Oryza sativa, a new family of membrane proteins possibly implicated in the transport of metal ions. Plant Mol Biol 33 1085–1092 - PubMed
    1. Bereczky Z, Wang HY, Schubert V, Ganal M, Bauer P (2003) Differential regulation of nramp and irt metal transporter genes in wild type and iron uptake mutants of tomato. J Biol Chem 278 24697–24704 - PubMed
    1. Bowler C, Slooten L, Vandenbranden S, De Rycke R, Botterman J, Sybesma C, Van Montagu M, Inzé D (1991) Manganese superoxide dismutase can reduce cellular damage mediated by oxygen radicals in transgenic plants. EMBO J 10 1723–1732 - PMC - PubMed

Publication types

MeSH terms