. 2006 Dec;142(4):1574-88.
doi: 10.1104/pp.106.086629. Epub 2006 Oct 27.

Variation of enzyme activities and metabolite levels in 24 Arabidopsis accessions growing in carbon-limited conditions

Affiliations

Variation of enzyme activities and metabolite levels in 24 Arabidopsis accessions growing in carbon-limited conditions

Joanna M Cross et al. Plant Physiol. 2006 Dec.

Abstract

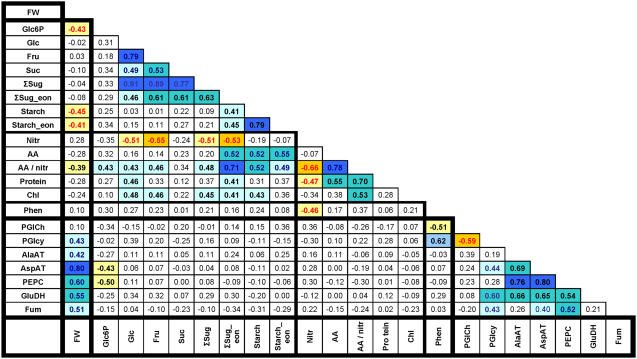
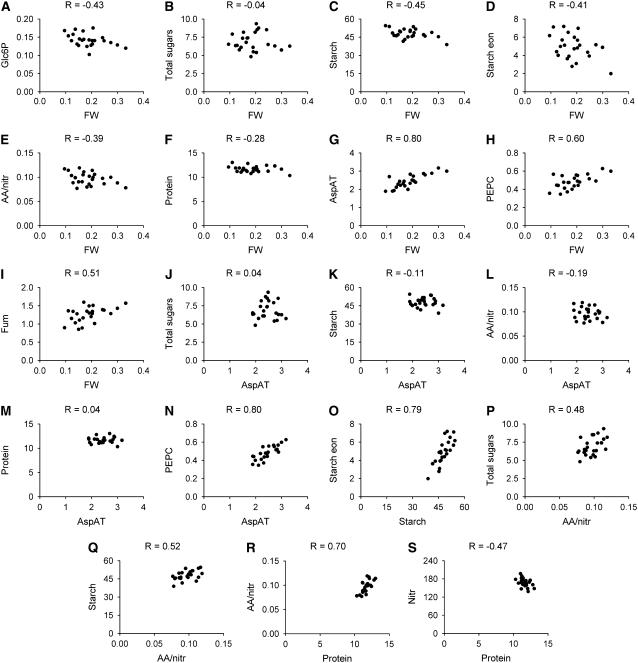
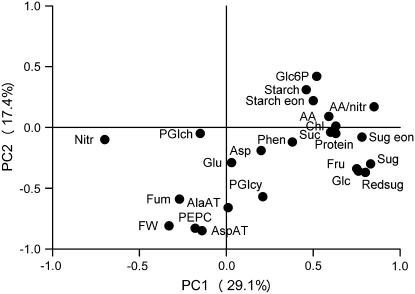
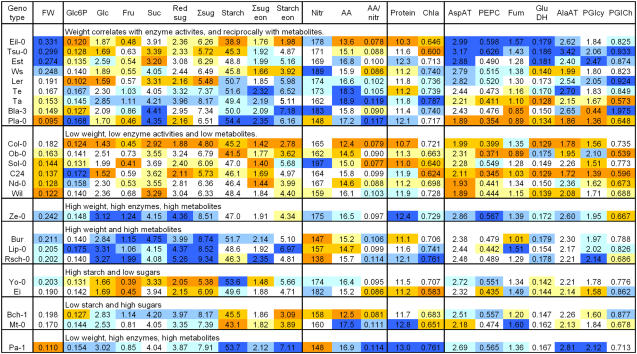
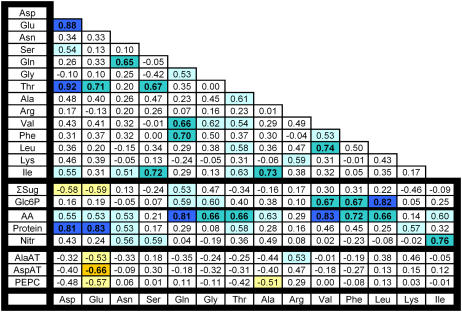
Our understanding of the interaction of carbon (C) metabolism with nitrogen (N) metabolism and growth is based mainly on studies of responses to environmental treatments, and studies of mutants and transformants. Here, we investigate which metabolic parameters vary and which parameters change in a coordinated manner in 24 genetically diverse Arabidopsis (Arabidopsis thaliana) accessions, grown in C-limited conditions. The accessions were grown in short days, moderate light, and high nitrate, and analyzed for rosette biomass, levels of structural components (protein, chlorophyll), total phenols and major metabolic intermediates (sugars, starch, nitrate, amino acids), and the activities of seven representative enzymes from central C and N metabolism. The largest variation was found for plant weight, reducing sugars, starch at the end of the night, and several enzyme activities. High levels of one sugar correlated with high levels of other sugars and starch, and a trend to increased amino acids, slightly lower nitrate, and higher protein. The activities of enzymes at the interface of C and N metabolism correlated with each other, but were unrelated to carbohydrates, amino acid levels, and total protein. Rosette weight was unrelated or showed a weak negative trend to sugar and amino acid contents at the end of the day in most of the accessions, and was negatively correlated with starch at the end of the night. Rosette weight was positively correlated with several enzyme activities. We propose that growth is not related to the absolute levels of starch, sugars, and amino acids; instead, it is related to flux, which is indicated by the enzymatic capacity to use these central resources.


Figures

Figure 1.
Figure 1.
Genetic correlations (Pearson coefficients) between different metabolic parameters in 24 accessions. For calculating correlations, the least-square means of the metabolites of each accession averaged across three experiments were used. The results are based on three independent experiments for end-of-day measurements and two experiments for end-of-night and DW studies. Relations that are significant at P < 0.0001, P < 0.01, and P < 0.05 are indicated by dark, medium, and light shading, with positive and negative correlations being distinguished by blue and orange. The original data are given in Supplemental Tables S1 and S3.
Figure 2.
Figure 2.
Scatter plots of the least-square mean values for selected parameters across 24 accessions. For each accession and parameter, the least-square mean average was calculated across the entire data set (see Fig. 3; Supplemental Table S5). The sections show scatter plots between the averages for selected parameters. The units are μmol/g FW for all metabolites, μmol g FW−1 min−1 for enzyme activities, and g for rosette FW. A to I, Rosette FW (x axis) versus Glc6P (A), total sugars (B), starch at the end of the day (C), starch at the end of the night (D), the amino acids to nitrate ratio (E), protein content (F), AspAT activity (G), PEPC activity (H), and fumarase activity (I). J to N, AspAT activity (x axis) versus total sugars (J), starch at the end of the day (K), the amino acids to nitrate ratio (L), protein content (M), and PEPC activity (N). O, Starch at the end of the day (x axis) versus starch at the end of the night. P and Q, The amino acids to nitrate ratio (x axis) versus total sugars (P) and starch at the end of the day (Q). R and S, Protein content (x axis) versus the amino acids to nitrate ratio (R) and nitrate content (S). The R values for each correlation are given in the sections.
Figure 3.
Figure 3.
Principal components analysis for 24 metabolites. Principal components analysis was performed on the correlation matrix of least-square means of accessions averaged across experiments (see Table I; Supplemental Table S5). Numbers in parentheses give the percent variation explained by the first and the second principal component. The figure shows the resulting distribution of metabolites, enzyme activities, and FW.
Figure 4.
Figure 4.
Least-square mean values of the metabolic parameters in individual accessions. For each accession and parameter, the least-square mean average was calculated across the entire data set. This least-square mean is given in the figure. Units are μmol/g FW for all metabolites, μmol g FW−1 min−1 for enzyme activities, and g for rosette FW. Each parameter was color coded, with deep, medium, and light blue indicating first-, second-, and third-, fourth-, fifth-, and sixth-, and seventh-, eighth-, and ninth-ranked genotypes, and light, medium, and deep orange indicating the 16th-, 17th-, and 18th-, 19th-, 20th-, and 21st-, and 22nd-, 23rd-, and 24th-ranked genotypes, respectively. The accessions are ranked according to the rosette FW in this figure. The accessions were then organized into groups that show a qualitatively similar response. The data are provided in xls format as Supplemental Table S5, to allow sorting according to other parameters. For abbreviations, see Figure 1.
Figure 5.
Figure 5.
Individual amino acids. Individual amino acid levels were determined by HPLC in 10 accessions (Bch-1, Bla-3, Bur, C24, Col-0, Lip-0, Nd-0, Wil, Ws, and Ze-0) in one sample experiment. Pearson correlation coefficients were calculated for each pairwise comparison of the metabolic parameters. Significant correlations (0.65 or more, P < 0.05) are bolded. Color coding is as follows: very light blue, correlations of 0.5 to 0.65; blue, correlations of 0.65 to 0.8; dark blue, correlations above 0.8; pale yellow, correlations of −0.65 to −0.5; and orange, correlations of −0.8 to −0.65. The original data are provided in Supplemental Table S6.

References

    1. Arnon DI (1949) Copper enzymes in isolated chloroplasts. Phenol oxidase in Beta vulgaris. Plant Physiol 24: 1–15 - PMC - PubMed
    1. Bantan-Polak T, Kassai M, Grant KB (2001) A comparison of fluorescamine and naphthalene-2,3-dicarboxaldehyde fluorogenic reagents for microplate-based detection of amino acids. Anal Biochem 297: 128–136 - PubMed
    1. Bläsing OE, Gibon Y, Gunther M, Hohne M, Morcuende R, Osuna D, Thimm O, Usadel B, Scheible WR, Stitt M (2005) Sugars and circadian regulation make major contributions to the global regulation of diurnal gene expression in Arabidopsis. Plant Cell 17: 3257–3281 - PMC - PubMed
    1. Calenge F, Saliba-Colombani V, Mathieu S, Loudet O, Daniel-Vedele F, Krapp A (2006) Natural variation for carbohydrate content in Arabidopsis. Interaction with complex traits dissected by quantitative genetics. Plant Physiol 141: 1630–1643 - PMC - PubMed
    1. Causse M, Rocher JP, Henry AM, Charcosset A, Prioul JL, de Vienne D (1995) Genetic dissection of the relationship between carbon metabolism and early growth in maize, with emphasis on key enzyme loci. Mol Breed 1: 259–272

Publication types