. 2007 Jan;189(2):491-500.
doi: 10.1128/JB.00909-06. Epub 2006 Nov 3.

Characterization of a higBA toxin-antitoxin locus in Vibrio cholerae

Affiliations

Characterization of a higBA toxin-antitoxin locus in Vibrio cholerae

Priya Prakash Budde et al. J Bacteriol. 2007 Jan.

Abstract

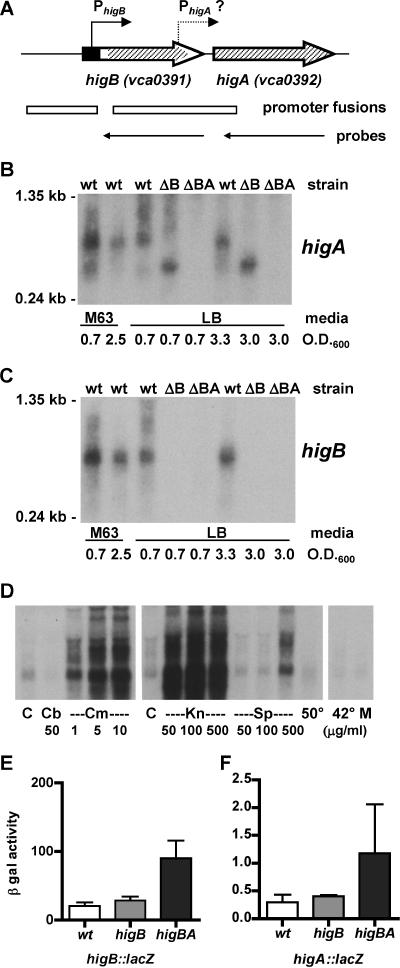
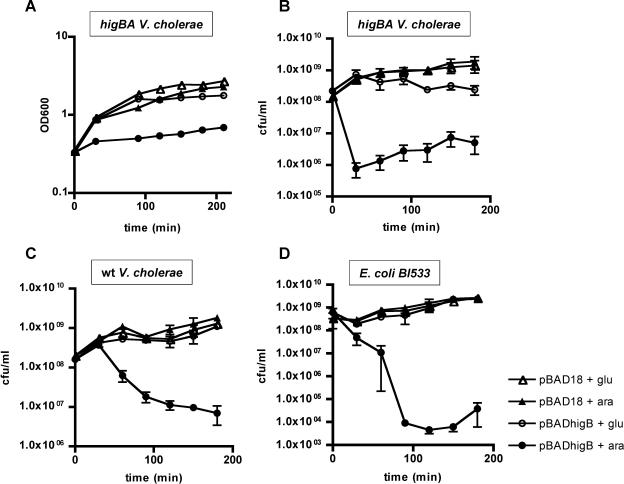
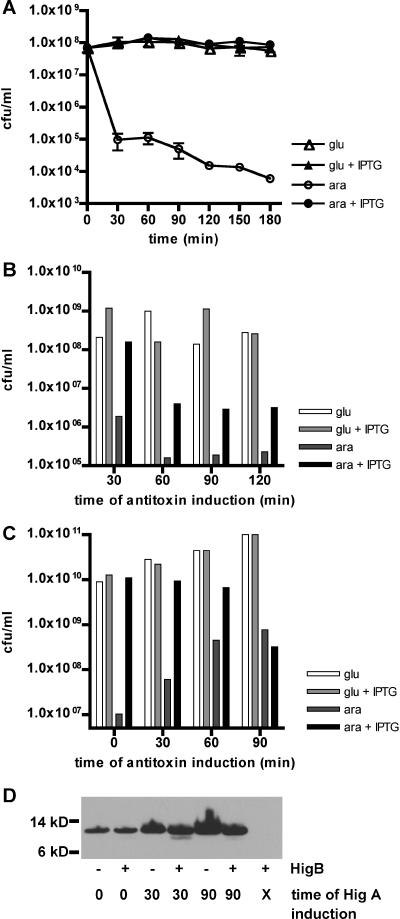
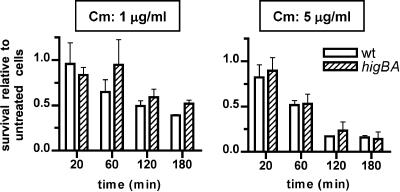
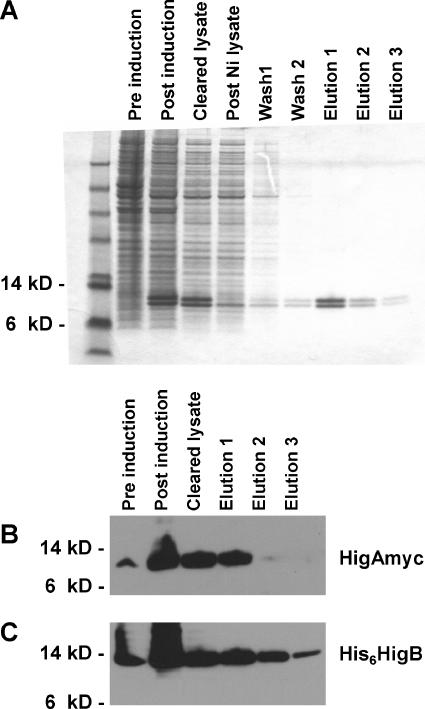
Toxin-antitoxin (TA) loci, which were initially characterized as plasmid stabilization agents, have in recent years been detected on the chromosomes of numerous free-living bacteria. Vibrio cholerae, the causative agent of cholera, contains 13 putative TA loci, all of which are clustered within the superintegron on chromosome II. Here we report the characterization of the V. cholerae higBA locus, also known as VCA0391/2. Deletion of higA alone was not possible, consistent with predictions that it encodes an antitoxin, and biochemical analyses confirmed that HigA interacts with HigB. Transient exogenous expression of the toxin HigB dramatically slowed growth of V. cholerae and Escherichia coli and reduced the numbers of CFU by several orders of magnitude. HigB toxicity could be counteracted by simultaneous or delayed production of HigA, although HigA's effect diminished as the delay lengthened. Transcripts from endogenous higBA increased following treatment of V. cholerae with translational inhibitors, presumably due to reduced levels of HigA, which represses the higBA locus. However, no higBA-dependent cell death was observed in response to such stimuli. Thus, at least under the conditions tested, activation of endogenous HigB does not appear to be bactericidal.


Figures

FIG. 1.
FIG. 1.
Expression and regulation of V. cholerae higBA. (A) Schematic representation of the higBA region of V. cholerae chromosome II, drawn approximately to scale. Thick arrows show genes, as annotated by TIGR, pointed in the direction of transcription. Bent arrows show the locations of the experimentally determined higBA promoter and the predicted higA promoter. The filled rectangle corresponds to the first 22 aa codons of annotated higB, which are not believed to be translated (see Fig. 2). Hatched areas denote regions deleted from higB and higA. Open rectangles show regions cloned to generate transcriptional reporter fusions in phigBlacZ and phigAlacZ. Thin arrows show regions transcribed in vitro to generate antisense riboprobes. (B) Northern blot of RNAs from wt, higB, and higBA strains of V. cholerae grown in either M63 or LB medium to various densities. The blot was probed with a riboprobe complementary to higA transcripts. (C) Northern blot as described for panel B, but probed with a riboprobe complementary to higB transcripts. (D) Northern blot of RNAs from wt V. cholerae grown in LB medium and treated with a variety of stresses. Cultures were grown at 37°C to an OD600 of ∼0.7 (left and right panels) or 0.5 (middle panel) and then either left at 37°C for an additional 20 min (control [C]) or incubated with carbenicillin (50 μg/ml [Cb]) or chloramphenicol (1 to 10 μg/ml [Cm]) for 20 min, with kanamycin (50 to 500 μg/ml [Kn]) or spectinomycin (50 to 100 μg/ml [Sp]) for 1 h, or with spectinomycin (500 μg/ml) or mitomycin C (20 ng/ml [M]) for 20 min. Heat-treated cells were shifted either to 42°C for 20 min or to 50°C for 10 min. The blot was probed with a riboprobe complementary to higB transcripts. (E) β-Galactosidase activities (Miller units) from a higB::lacZ transcriptional reporter fusion (phigBlacZ) in wt, higB, and higBA strains of V. cholerae. Data are averages for at least three experiments. (F) β-Galactosidase activities (Miller units) from a higA::lacZ transcriptional reporter fusion (phigAlacZ) in wt, ΔhigB, and ΔhigBA strains of V. cholerae. Data are averages for at least three experiments.
FIG. 2.
FIG. 2.
Determination of transcriptional and translational start sites for V. cholerae higB. (A) Alignment of the 5′ ends of annotated V. cholerae HigB and characterized or putative HigBs from Salmonella enterica serovar Typhimurium, Yersinia pestis, Idiomarina loihiensis, and Rts1. Conserved amino acids are shaded. (B) Annotated and experimentally determined start sites for V. cholerae higB and HigB. The annotated translational start is shown in bold italics, the experimentally determined translational start site is boxed, and the experimentally determined transcriptional start site is underlined and marked with a bent arrow. (C) Primer extension analysis of the 5′ end of V. cholerae higB transcripts. The sequence corresponds to the bottom strand shown in panel B. RT, reverse transcription reaction performed with a higB-specific primer. The same start site was also identified using 5′ rapid amplification of cDNA ends (data not shown).
FIG. 3.
FIG. 3.
Effects of HigB production on culture density and CFU of V. cholerae and E. coli. Strains contained either pBAD18 (triangles) or pBADhigB (circles). All cultures were grown in LB medium plus 0.2% glucose, washed, and resuspended in either LB plus 0.02% glucose (open symbols) or LB plus 0.02% arabinose (filled symbols) at time zero. Culture densities and/or CFU were enumerated at subsequent time points. (A) OD600 for V. cholerae higBA strain. (B) CFU of V. cholerae higBA strain. (C) CFU of wt V. cholerae. (D) CFU of E. coli BI533.
FIG. 4.
FIG. 4.
Effects of HigA production coincident with or subsequent to induction of HigB in V. cholerae and E. coli. All cultures were grown in LB medium plus 0.2% glucose, washed, and resuspended in either LB plus 0.2% glucose or LB plus 0.02% arabinose at time zero. At either time zero (A) or subsequent time points (B, C, and D), IPTG was added to some cultures to induce production of HigA (A) or HigA-Myc (B, C, and D). After further incubation, cells were plated to enumerate CFU (A, B, and C) or harvested for protein isolation and Western blotting. Results of representative experiments are shown in each panel. (A) CFU of N16961 ΔhigBA(pBADhigB/pGZHigA). (B) CFU of N16961 ΔhigBA(pBADhigB/pGZHigAmyc). (C) CFU of E. coli BW27784(pBADhigB/pGZHigAmyc). (D) Western blot of E. coli BW27784(pBADhigB/pGZHigAmyc) probed with anti-Myc antibody. Lane X, no addition of IPTG to induce HigA-Myc production.
FIG. 5.
FIG. 5.
Survival of wt and higBA mutant V. cholerae cells following exposure to chloramphenicol. Cultures of wt (open bars) and higBA mutant (hatched bars) V. cholerae were grown to an OD600 of ∼0.7, split, and either treated with 1 or 5 μg/ml chloramphenicol (Cm) or left untreated. After various times, cultures were plated on LB agar without chloramphenicol to enumerate CFU. Survival represents the number of CFU in treated cultures relative to the number of cells in untreated cultures at the same time point. Each bar is the average value for two to four experiments.
FIG. 6.
FIG. 6.
Affinity purification of His6HigB and associated HigA-Myc. His6HigB and HigA-Myc were coexpressed from pQE30HigBAmyc in E. coli XL1Blue, and His6HigB was affinity purified from cell extracts, using Ni-NTA resin under nondenaturing conditions. Cell extracts and subsequent fractions from the purification were run in denaturing polyacrylamide gels and then analyzed using either Coomassie blue staining or Western blotting. (A) Proteins from various purification stages stained with colloidal Coomassie blue. (B) Western blot of pre- and postpurification fractions probed with anti-Myc antibody. (C) Western blot of pre- and postpurification fractions probed with anti-His6 antibody.

References

    1. Aizenman, E., H. Engelberg-Kulka, and G. Glaser. 1996. An Escherichia coli chromosomal “addiction module” regulated by guanosine 3′,5′-bispyrophosphate: a model for programmed bacterial cell death. Proc. Natl. Acad. Sci. USA 93:6059-6063. - PMC - PubMed
    1. Amitai, S., Y. Yassin, and H. Engelberg-Kulka. 2004. MazF-mediated cell death in Escherichia coli: a point of no return. J. Bacteriol. 186:8295-8300. - PMC - PubMed
    1. Anantharaman, V., and L. Aravind. 2003. New connections in the prokaryotic toxin-antitoxin network: relationship with the eukaryotic nonsense-mediated RNA decay system. Genome Biol. 4:R81. - PMC - PubMed
    1. Buts, L., J. Lah, M. H. Dao-Thi, L. Wyns, and R. Loris. 2005. Toxin-antitoxin modules as bacterial metabolic stress managers. Trends Biochem. Sci. 30:672-679. - PubMed
    1. Christensen, S. K., and K. Gerdes. 2003. RelE toxins from bacteria and archaea cleave mRNAs on translating ribosomes, which are rescued by tmRNA. Mol. Microbiol. 48:1389-1400. - PubMed

Publication types

LinkOut - more resources