

Recent history of artificial outcrossing facilitates whole-genome association mapping in elite inbred crop varieties
- PMID: 17085595
- PMCID: PMC1693718
- DOI: 10.1073/pnas.0606133103
Recent history of artificial outcrossing facilitates whole-genome association mapping in elite inbred crop varieties
Abstract
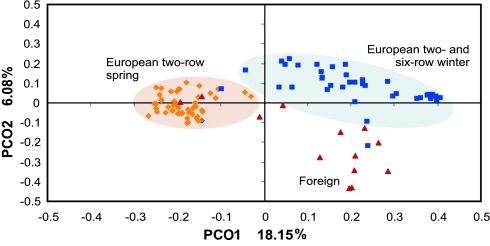
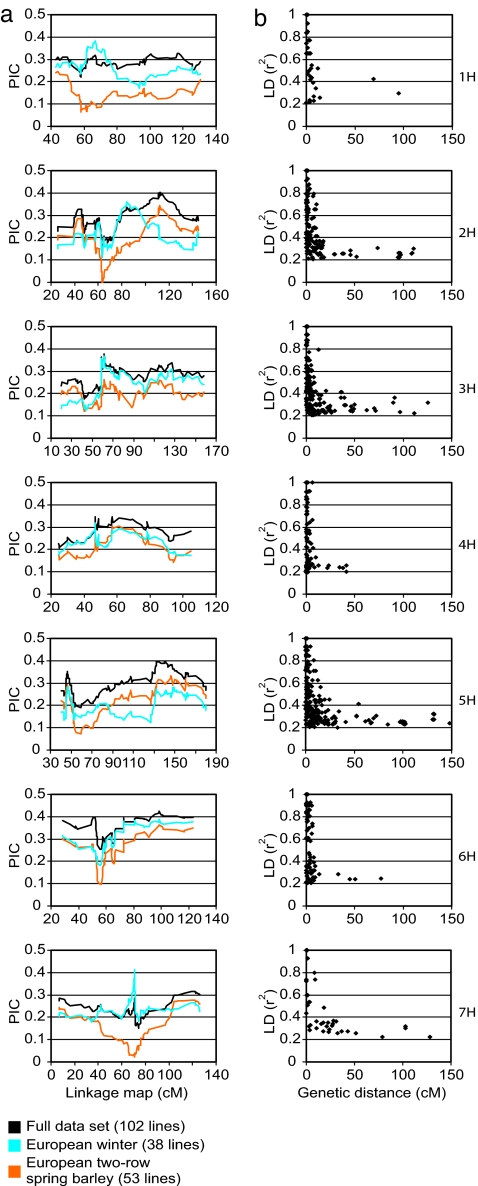
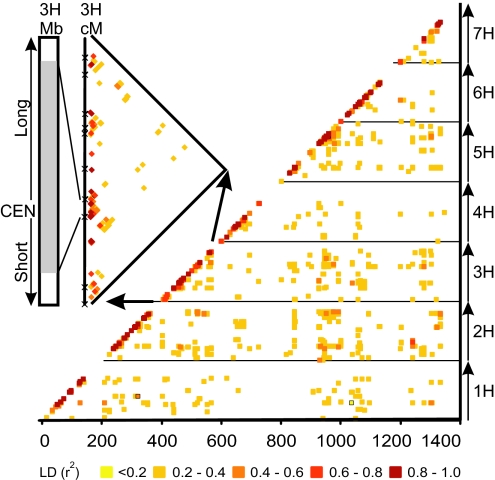
Genomewide association studies depend on the extent of linkage disequilibrium (LD), the number and distribution of markers, and the underlying structure in populations under study. Outbreeding species generally exhibit limited LD, and consequently, a very large number of markers are required for effective whole-genome association genetic scans. In contrast, several of the world's major food crops are self-fertilizing inbreeding species with narrow genetic bases and theoretically extensive LD. Together these are predicted to result in a combination of low resolution and a high frequency of spurious associations in LD-based studies. However, inbred elite plant varieties represent a unique human-induced pseudo-outbreeding population that has been subjected to strong selection for advantageous alleles. By assaying 1,524 genomewide SNPs we demonstrate that, after accounting for population substructure, the level of LD exhibited in elite northwest European barley, a typical inbred cereal crop, can be effectively exploited to map traits by using whole-genome association scans with several hundred to thousands of biallelic SNPs.
Conflict of interest statement
The authors declare no conflict of interest.
Figures
Comment in
-
Disequilibrium and association in barley: thinking outside the glass.Proc Natl Acad Sci U S A. 2006 Dec 5;103(49):18385-6. doi: 10.1073/pnas.0609405103. Epub 2006 Nov 27. Proc Natl Acad Sci U S A. 2006. PMID: 17130443 Free PMC article. Review. No abstract available.
References
-
- Lander ES, Schork NJ. Science. 1994;265:2037–2048. - PubMed
-
- Ardlie KG, Kruglyak L, Seielstad M. Nat Rev Genet. 2002;3:299–309. - PubMed
-
- Hirschhorn JN, Daly MJ. Nat Rev Genet. 2005;6:95–108. - PubMed
-
- Tishkoff SA, Verrelli BC. Annu Rev Genomics Hum Genet. 2003;4:293–340. - PubMed
-
- Nordborg M, Tavare S. Trends Genet. 2002;18:83–90. - PubMed
Publication types
MeSH terms
Grants and funding
LinkOut - more resources
Full Text Sources
Research Materials
