. 2006 Nov 20;45(33):8547-59.
doi: 10.1364/ao.45.008547.

Tomographic imaging of oxygen by phosphorescence lifetime

Affiliations

Tomographic imaging of oxygen by phosphorescence lifetime

Sovia V Apreleva et al. Appl Opt. .

Abstract

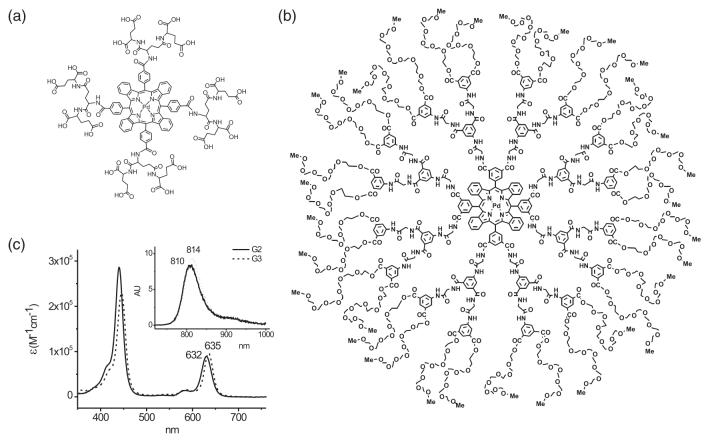
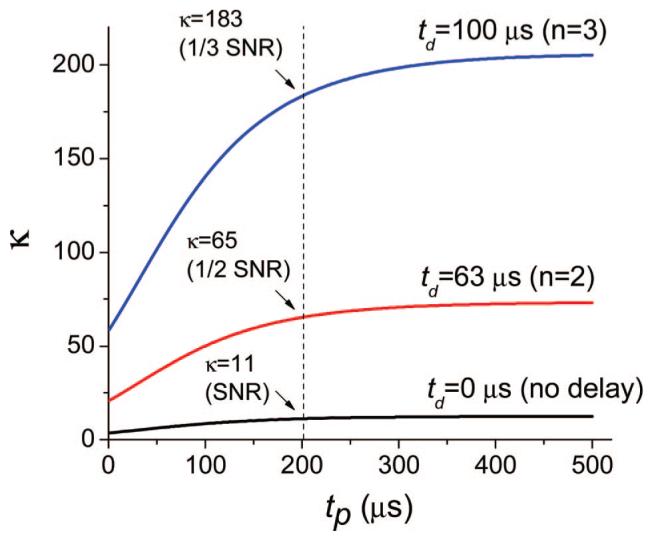
Imaging of oxygen in tissue in three dimensions can be accomplished by using the phosphorescence quenching method in combination with diffuse optical tomography. We experimentally demonstrate the feasibility of tomographic imaging of oxygen by phosphorescence lifetime. Hypoxic phantoms were immersed in a cylinder with scattering solution equilibrated with air. The phantoms and the medium inside the cylinder contained near-infrared phosphorescent probe(s). Phosphorescence at multiple boundary sites was registered in the time domain at different delays (t(d)) following the excitation pulse. The duration of the excitation pulse (t(p)) was regulated to optimize the contrast in the images. The reconstructed integral intensity images, corresponding to delays t(d), were fitted exponentially to give the phosphorescence lifetime image, which was converted into the three-dimensional image of oxygen concentrations in the volume. The time-independent diffusion equation and the finite element method were used to model the light transport in the medium. The inverse problem was solved by the recursive maximum entropy method. We provide what we believe to be the first example of oxygen imaging in three dimensions using long-lived phosphorescent probes and establish the potential of these probes for diffuse optical tomography.


Figures

Fig. 1
Fig. 1
Phosphorescent probes (a) Oxyphor G2, (b) Oxyphor G3, and (c) their absorption and emission spectra.
Fig. 2
Fig. 2
(Color online) Simulation of dependence of contrast ratio κ on pulse duration tp for different delays td. Two volumes with pO2(1) = 50 mm Hg-11 = 25 μs) and pO2(2) = 10 mm Hg-12 = 91 μs), containing equal amounts of phosphorescent probe (kq = 700 mm Hg-1 s-1, τ0 = 250 μs), were equally excited by a rectangular pulse of duration tp. Delays td (start of the data integration) correspond to the moments of time when the intensity of the decay with longer lifetime (τ2) was reduced n times: td(n) = τ2 ln(n).
Fig. 3
Fig. 3
(Color online) Numerical simulation and recovery of phosphorescence lifetime distributions in the scattering cylinder (dimensions in millimeters). Dots on the periphery of the cylinder correspond to the positions of the source and detector sites. Only cross sections (x-z plane) of complete 3D images are shown. (a) Integral intensity images recovered by the MEM from the data obtained at different delays td (shown above the images in microseconds). Data set (a) was produced using a 70 μs excitation pulse (tp = 70 μs), SNR = 135. Lifetime images (b) and (c) were obtained by fitting the intensity images either (b) including all the images in the series, td = 13-472 μs, or (c) ignoring the images taken at shorter delays td = 36-472 μs. The lifetime scale (microseconds) is shown on the left in pseudocolor. Images (b) and (c) were produced using excitation pulses of different lengths (tp = 10, 70, and 250 μs).
Fig. 4
Fig. 4
(Color online) Experimental image reconstructions in a cylinder. x-z cross sections of complete 3D images are shown (dimensions in millimeters). Excitation pulse was 200 μs long (tp = 200 μs). (a) Oxygen image and (b) phosphorescence lifetime image of a phantom (τ2 = 190 μs, pO2 = 0.2 Torr, Oxyphor G2) in solution with a low background (τ1 < 5 μs). Lifetime image was recovered using a series of MEM-reconstructed phosphorescence intensity images (e), with the first image (not shown in the figure) taken after a delay td1 = 27 μs. (c) and (d) Lifetime images of the phantom (τ2 = 170 μs) in solution with strong background phosphorescence ( τ1 = 45 μs, Oxyphor G3). Lifetime image obtained from intensity images taken after delays (c) td1 = 20 μs and (d) td1 = 60 μs.

References

    1. Arden GB, Sidman RL, Arap W, Schlingemann RO. Spare the rod and spoil the eye. Br. J. Ophthamol. 2005;89:764–769. - PMC - PubMed
    1. Pena F, Ramirez AM. Hypoxia-induced changes in neuronal network properties. Mol. Neurobiol. 2005;32:251–283. - PubMed
    1. Ferriero DM. Medical progress—neonatal brain injury. New Eng. J. Med. 2004;351:1985–1995. - PubMed
    1. Evans SM, Koch CJ. Prognostic significance of tumor oxygenation in humans. Cancer Lett. 2003;195:1–16. - PubMed
    1. Shah N, Cerussi AE, Jakubowski D, Hsiang D, Butler J, Tromberg BJ. The role of diffuse optical spectroscopy in the clinical management of breast cancer. Dis. Markers. 2003;19:95–105. - PMC - PubMed

Publication types

MeSH terms