Review
. 2006 Nov 13;45(44):7336-56.
doi: 10.1002/anie.200601554.

Reactions in droplets in microfluidic channels

Affiliations
Review

Reactions in droplets in microfluidic channels

Helen Song et al. Angew Chem Int Ed Engl. .

Abstract

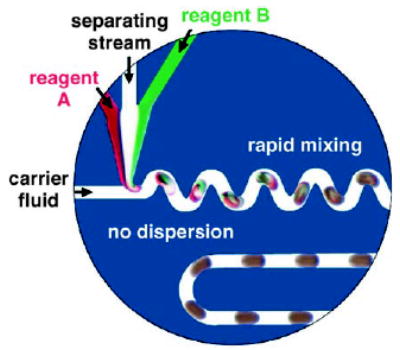
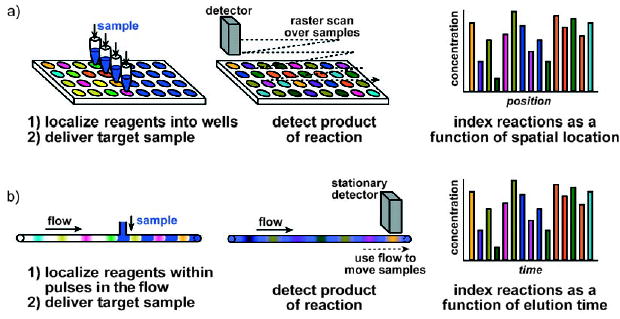
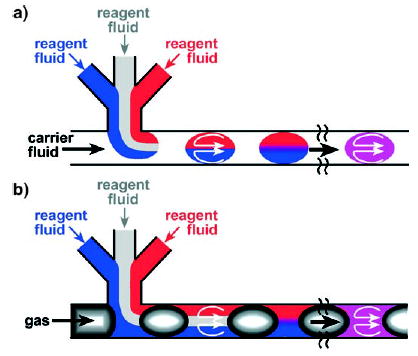
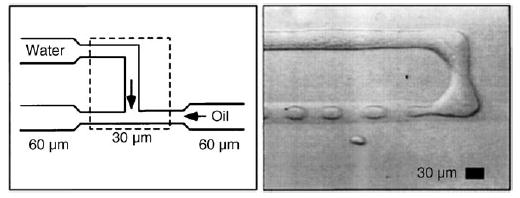
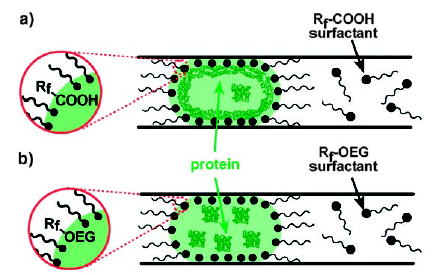
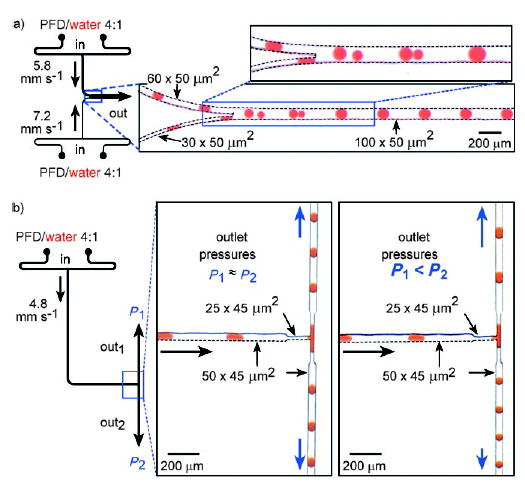
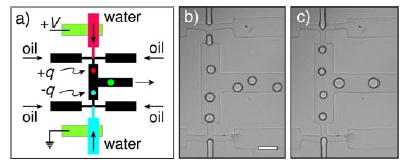
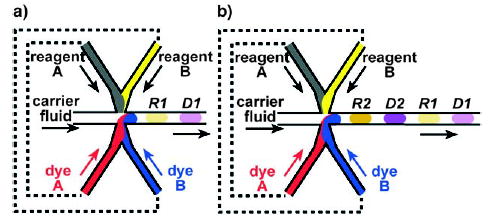
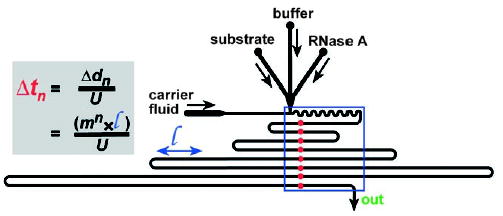
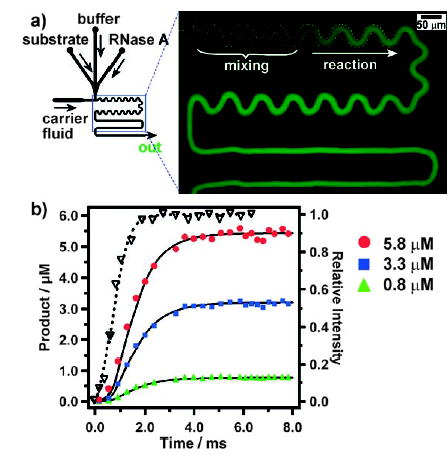
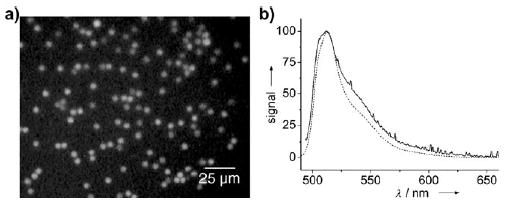
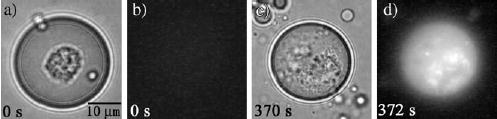
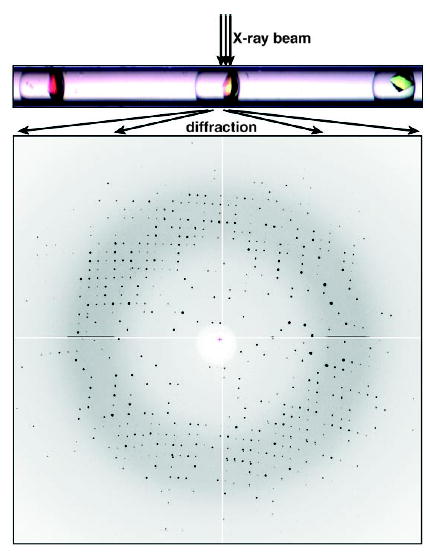
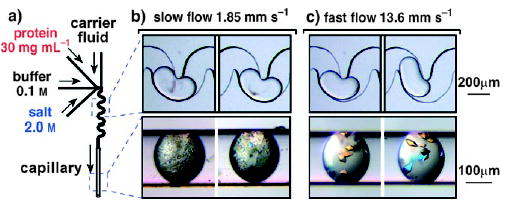
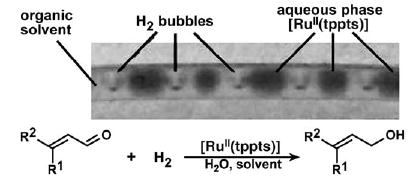
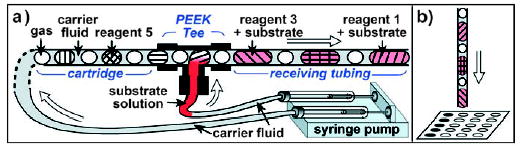
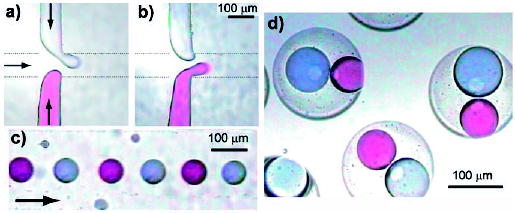
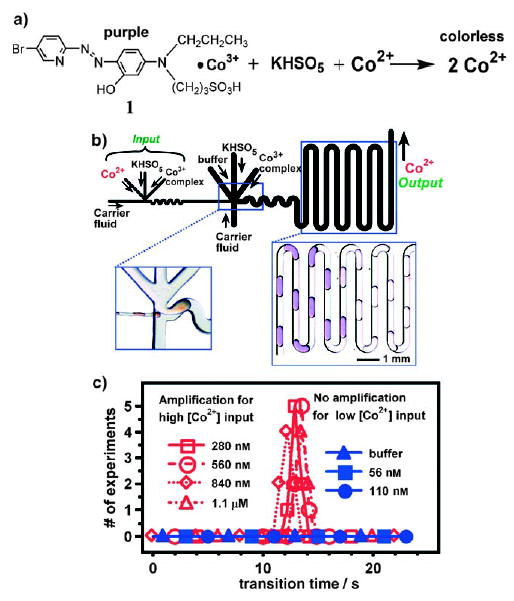
Fundamental and applied research in chemistry and biology benefits from opportunities provided by droplet-based microfluidic systems. These systems enable the miniaturization of reactions by compartmentalizing reactions in droplets of femoliter to microliter volumes. Compartmentalization in droplets provides rapid mixing of reagents, control of the timing of reactions on timescales from milliseconds to months, control of interfacial properties, and the ability to synthesize and transport solid reagents and products. Droplet-based microfluidics can help to enhance and accelerate chemical and biochemical screening, protein crystallization, enzymatic kinetics, and assays. Moreover, the control provided by droplets in microfluidic devices can lead to new scientific methods and insights.


Figures

None
Helen Song received her BSc and MSc degrees in chemistry at the University of Chicago. She started her work in developing techniques for droplet-based microfluidics and using this method to study enzyme kinetics at the University of Chicago in 2002 under the supervision of Prof. Rustem Ismagilov. She successfully defended her PhD thesis in 2005.
None
Delai Chen received his BSc in chemistry at Peking University and his MSc in chemistry at the University of Chicago. He started his work on using droplet-based microfluidics to study stochastic processes in protein crystallization and to optimize conditions in organic reactions at the University of Chicago in 2004 under the supervision of Prof. Rustem Ismagilov.
None
Rustem Ismagilov received his PhD in 1998 at University of Wisconsin, Madison under the direction of Prof. Stephen F. Nelsen and was a postdoctoral fellow with Professor George M. Whitesides at Harvard University. He began his independent career at the University of Chicago in 2001 and was promoted to Associate Professor in 2005. His current research involves using microfluidics to control complex chemical and biological systems in space and time.
Figure 1
Figure 1
Droplets formed within microfluidic channels can serve as microreactors. In this example, the reactions are performed within aqueous droplets, which contain reagent A, reagent B, and a separating stream containing buffer. The droplets are encapsulated by a layer of a fluorinated carrier fluid and transported through the microchannels. Reprinted from reference [1].
Figure 2
Figure 2
Comparison of reactions compartmentalized in parallel and in series. a) Parallel reactions performed by using well plates: The reagents are localized within wells, and the target sample is delivered to the well through a multipipettor. The reaction products are detected by scanning over the samples, and each reaction is indexed as a function of the spatial location of each well. b) Serial reactions performed by using flow. Reactions are localized within pulses and separated by a buffer solution between each reagent. These pulses are transported through the reaction tube by the flow, and the target sample is delivered to the reagents. The pulses are transported by the flow past a stationary detector to analyze the reaction products. Each reaction is indexed as a function of the elution time.
Figure 3
Figure 3
Reactions can be studied in two types of segmented flows in microfluidic channels. a) Discrete liquid plugs are encapsulated by an immiscible continuous phase (for example, a fluorocarbon-based carrier fluid). Reactions occur within the dispersed phase (within the plugs). Owing to the surface properties of the microchannel walls, these walls are preferentially wet by the continuous phase. b) Aqueous slugs are separated by another immiscible phase (for example, discrete gas bubbles). Reactions occur within the continuous phase (i.e., within the slugs).
Figure 4
Figure 4
Formation of droplets within a T junction of a microfluidic device.[35] In this case, the oil is a mixture of hydrocarbon and the surfactant Span80, and the channels are made of polymerized acrylated urethane. Reprinted with permission from reference [35]. Copyright 2001 American Physical Society.
Figure 5
Figure 5
Formation of droplets by flow-focusing.[111] Modified from reference [111]. a) A schematic of the device. The rectangle outlines the field of view in (b). Copyright 2003 American Institute of Physics.
Figure 6
Figure 6
Preformed cartridges of plugs enable the combination of a large number of reagents with a sample in sub-microliter volumes.[42, 124] a,b) Four different reagents stored as an array of plugs in a capillary. The plugs are separated by a fluorocarbon carrier fluid, as well as air bubbles (in b), to prevent cross-communication between the plugs. Scale bars: 200 μm. c) Merging of plugs from a preformed cartridge with a target sample stream through a T junction. The resulting array of plugs is transferred into a receiving capillary and the trials are collected. d) Photograph of the T junction. Reprinted from reference[42] (a,b) and with permission from Elsevier from reference [124] (c,d).
Figure 7
Figure 7
Controlling the concentrations of reagents within plugs by on-chip dilution.[44] a) Experimental setup; the blue rectangle shows the field of view for microphotographs shown in (c). b) A graph quantifying the on-chip dilution method. The concentrations measured from the fluorescence intensity of plugs traveling through the microchannel are plotted as a function of theoretical concentration calculated from the flow rates of the streams containing reagent A, the dilution buffer, and reagent B. c) The concentrations of the reagents were controlled by the relative flow rates of the reagent streams (values in parentheses, in nLs−1). Reprinted with permission from reference [44]. Copyright 2003 American Chemical Society.
Figure 8
Figure 8
Injection of a CaCl2 solution into a plug (blood) through a hydrophilic side channel.[132] a) Time-lapse microphotographs of the injection process. b) The injection volume is controlled by the flow rate (μLmin−1) of the CaCl2 stream. Each data point on the graph denotes measurements for 10 plugs (y = 24.947x−0.2312, R2 = 0.9849). Reprinted with permission from reference [132]. Copyright 2006 American Chemical Society.
Figure 9
Figure 9
Model for the mixing of two reagents by chaotic advection at low values of the Reynolds number; photographs of two layers of modeling clay being stretched and folded. Images are courtesy of Joshua D. Tice.
Figure 10
Figure 10
Mixing by chaotic advection in a plug moving through a winding channel. The interfaces between the red and blue fluids are reoriented, stretched, and folded as the plug moves through the corners and straight sections of the channel. Reprinted with permission from reference [40]. Copyright 2003 American Institute of Physics.
Figure 11
Figure 11
Rapid mixing in droplets by chaotic advection.[40] Left: Schematics of the microfluidic network. Right: a) Bright-field and b) fluorescence microscopy images of plugs moving through winding channels. The observed fluorescence is a time average of the fluorescence of many plugs passing through the field of view throughout the 2-s exposure time. The mixing was quantified by using the fluorogenic substrate Fluo-4, whose fluorescence increases upon binding to Ca2+. Figure reprinted with permission from reference [40]. Copyright 2003 American Institute of Physics.
Figure 12
Figure 12
Mixing of viscous solutions in plugs with a bumpy mixer.[45] a) Schematic of the bumpy serpentine mixer; CS: crowded solutions, X and Y: reagents. b) Mixing of plugs containing bovine serum albumin (BSA, 200 mgmL−1) and a calcein dye. c) Images of the striations observed inside the plugs during mixing of a hemoglobin solution (300 mgmL−1) with a BSA solution (260 mgmL−1 with 5 mM calcein). Figure reprinted with permission from reference [45]. Copyright 2006 American Chemical Society.
Figure 13
Figure 13
Control of the surface behavior of plugs with surfactants at the interface between the aqueous and fluorous phases. a) A COOH surfactant with a fluorinated side chain (Rf ) provides a non-inert interface that is prone to protein adsorption. b) A surfactant with a fluorinated side chain and a polar oligoethyleneglycol (OEG) head group provides an inert, biocompatible interface. Reprinted with permission from reference [43]. Copyright 2005 American Chemical Society.
Figure 14
Figure 14
Merging and splitting of droplets in microchannels.[1] Left: Schematic of the microfluidic network. Right: Microphotographs of plugs traveling through the microchannel. a) Spontaneous merging of pairs of plugs into single plugs in the main microchannel. b) Spontaneous splitting of plugs at the branching point in a microchannel. When the outlet pressures are equal, a stream of plugs splits into plugs of approximately half the volume of the initial plugs (middle). When the outlet pressures are different, asymmetric splitting of plugs is observed (right). Perfluorodecalin (PFD) serves as the carrier fluid. Reprinted from reference [1].
Figure 15
Figure 15
Coalescence of drops by means of electric forces.[170a] a) Drops with opposite signs of electrostatic charge could be generated by applying a voltage across the two aqueous streams. b) In the absence of an electric field, the frequency and timing of drop formation at the two nozzles are independent even at identical infusion rates. In the presence of surfactant, the drops did not coalescence upon confluence of the two streams (scale bar: 100 μm). c) With an applied voltage of 200 V (separation of the nozzles: 500 μm), the drops broke off from the two nozzles simultaneously and coalesced upon confluence. Reprinted with minor modification from reference [170a].
Figure 16
Figure 16
The concentrations within the droplets can be indexed by producing alternating droplets within the microchannels.[41] Pairs of droplets R and D are formed; droplet R contains the reagents, and droplet D contains dyes for indexing. The flow rates of reagent A and dye A and of reagent B and dye B are correlated (indicated by the dashed lines). a) The concentrations of reagents A and B in R1 are correlated with the concentrations of dyes A and B, respectively, in D1, so that the concentrations of dyes A and B in D1 can be used to index the concentrations of reagents A and B in R1. b) An array of alternating droplets. Reprinted with permission from reference [41] with minor modifications. Copyright 2004 American Chemical Society.
Figure 17
Figure 17
Kinetic measurements by analysis of a single microphotograph of droplets traveling through a microchannel.[44] The red points indicate time points tn, and the blue rectangle outlines the field of view for the fluorescence microphotograph. The reaction being measured within the droplets should result in a change in fluorescence (as in Figure 11b). The time course of the reaction can be obtained by measuring the fluorescence intensity at each position (red circles) within the microphotograph. The equation shown enables the time difference between each point to be determined; Δtn [s] is the time interval between n = 1 to 8 (for each row of microchannel in the field of view), m = 1.5, l = 0.9 mm, U = 106 mms−1. Reprinted with permission from reference [44]. Copyright 2003 American Chemical Society.
Figure 18
Figure 18
Kinetic analysis on a millisecond timescale of the turnover of RNase A in plugs.[44] a) Left: Experimental setup. Right: Fluorescence microphotograph (false-colored) that shows the time-averaged (exposure time 2 s) intensity of aqueous plugs and carrier fluid moving through the microchannel. b) Graph of the experimental kinetic data for three substrate concentrations at 0.8 (▴), 3.3 (▪), and 5.8 μM (•); the data is obtained from analysis of images such as that in (a). Also shown is a mixing curve (right axis, ▽) for a Fluo-4/Ca2+ system in the same microfluidic device. The solid lines are fits of the reaction progress including explicit treatment of mixing. Reprinted with permission from reference [44]. Copyright 2003 American Chemical Society.
Figure 19
Figure 19
In vitro translation of GFP within droplets.[149] a) Fluorescence microphotograph of the droplets after GFP expression. The droplets were collected in a microfabricated well. b) Fluorescence spectrum of GFP; dashed line: commercially obtained protein in aqueous solution, solid line: individual droplet after in vitro expression. Reprinted from reference [149].
Figure 20
Figure 20
An enzymatic assay for a single mast cell within a droplet.[175] a, c) Brightfield images; b, d) fluorescence images. Reprinted with permission from reference [175]. Copyright 2005 American Chemical Society.
Figure 21
Figure 21
Fluorescence microscopy of a) GFP encapsulated in DOPC vesicles; b) a single Hela cervical carcinoma cell (diameter 10 μm) encapsulated in a DOPC vesicle; c) MCF7 breast cancer cell encapsulated in a DMPC vesicle. Reprinted from reference [177]. Copyright 2006 American Chemical Society. DOPC = dioleoylphosphatidylcholine, DMPC = dimyristoylphosphatidylcholine.
Figure 22
Figure 22
Optical microphotograph of the liquid-injection part of an integrated DNA analyzer. Reprinted from reference [51]. Copyright 1998 AAAS.
Figure 23
Figure 23
Gradient screening of protein crystallization conditions in droplets.[128] a–c) The concentrations of the crystallizing reagents (PEG, buffer, protein, and NaCl) are varied by varying the relative flow rates of the reagents. d) Experimental characterization of the gradient screen. Two droplets with volume of 7.5 nL were formed each second; each data point represents one droplet. Reprinted with permission from reference [128]. Copyright 2003 American Chemical Society.
Figure 24
Figure 24
Protein crystallization by the vapor-diffusion method by using alternating droplets.[34] Microphotographs of a pair of alternating droplets at 0 h (left) and at 24 h (right) after the droplets were transported into the capillary. A crystal formed within the droplet of the protein solution after the volume of the droplet decreased by 50%. Dashed lines indicate the interfaces between the aqueous droplets and the carrier fluid. Reprinted from reference [34].
Figure 25
Figure 25
On-chip X-ray diffraction of thaumatin crystals within a capillary.[34] Reprinted from reference [34].
Figure 26
Figure 26
Study of the influence of mixing on the nucleation of protein crystals by using droplets.[183] a) Experimental setup. b) At a low flow rate, precipitation was observed (top image); precipitate and microcrystals grew within the plugs (bottom image). c) At a higher flow rate, fewer and larger crystals were observed (bottom image). Reprinted with permission from reference [183]. Copyright 2005 American Chemical Society.
Figure 27
Figure 27
Catalytic multiphase reaction for the hydrogenation of unsaturated aldehydes performed by using alternating droplets.[191] Photograph of a capillary (diameter 750 μm) containing alternating H2 bubbles and aqueous droplets. The continuous phase is an organic solvent (either toluene or hexane) that contains the unsaturated aldehyde. Figure reprinted from reference [191].
Figure 28
Figure 28
Testing of the conditions of organic reactions in plugs with subsequent analysis by MALDI-MS.[126] a) Setup for serial merging of the reagent plugs with a stream of substrate solution. “PEEK Tee” is a commercially available T junction. b) The reaction plugs are deposited on a MALDI plate for analysis. Figure reprinted from reference [126]. Copyright 2006 American Chemical Society.
Figure 29
Figure 29
Synthesis of monodisperse particles of silica gel with a segmented-flow reactor (SFR).[192] Various residence times τ resulted in silica particles with different average diameters davg. SEM microphotographs are shown for a) τ = 9 min, davg = 407 nm, and b) τ = 14 min, davg = 540 nm. c) Low-magnification SEM image of sample shown in (b). d) Standard deviation of the mean diameter σ versus τ for particles formed by using an SFR or a batch reactor. Reprinted with permission from reference [192]. Copyright 2004 American Chemical Society.
Figure 30
Figure 30
Multiple-step synthesis of nanoparticles in droplets on a millisecond timescale.[129] a) Experimental setup. b) UV/Vis spectra of four types of CdS nanoparticles; reaction conditions: 1) CdCl2/Na2S 20:1, quench with methylpropionic acid (MPA) (black); 2) CdCl2/Na2S 10:1, quench with MPA (red); 3) CdCl2/Na2S 1:1, quench with Na2S (blue). 4) CdS/CdSe core–shell nanoparticle, synthesized using CdCl2/Na2S 1:1 with Na2Se quenching (green). Reprinted with permission from reference [129]. Copyright 2004 The Royal Society of Chemistry.
Figure 31
Figure 31
Nylon-coated aqueous droplets generated by interfacial polymerization at the liquid–liquid interface of droplets.[117] Top: a) Capsules with narrow size distribution formed with an axially symmetric flow focusing device. b) Capsules containing magnetic particles that align in an induced magnetic field. c) Capsules containing NaCl were dehydrated by adding ethanol (frame 1). As ethanol was exchanged for water, the membrane swelled over time (frames 2–4). After 30 s, the capsules were fully swelled (frame 4). Reprinted from reference [117].
Figure 32
Figure 32
Monodisperse particles with controlled shape and sizes generated in droplets.[194] a) Polymer microspheres, b) a crystal of polymer microspheres, c) polymer rods, d) polymer disks, e) polymer ellipsoids, f) agarose disks, and g) bismuth alloy ellipsoids. Reprinted from reference [194].
Figure 33
Figure 33
Formation of double emulsions by encapsulation of alternating droplets.[206] Alternating red and blue droplets were formed (a, b) and transported through the microchannel (c) to another droplet-forming region. Double emulsions that contained one red and one blue droplet were formed (d). Reprinted with permission from reference [206]. Copyright 2004 American Chemical Society.
Figure 34
Figure 34
Signal amplification with a reaction network that relies on a droplet-based microfluidic system.[163] a) Autocatalytic formation of the Co3+ complex 1. b) Schematic of the microfluidic device for two-stage amplification. The first stage of the reaction takes place in the thinner channels. The second stage takes place in the thicker channels. Left: Microphotograph of the merging junction, where small droplets of a red solution merge with larger ones. Right: Microphotograph of plugs containing the autocatalytic reaction mixture; the abrupt color transition corresponds to the conversion of the purple Co3+ complex (1) into colorless Co2+ ions. c) Below a threshold initial concentration of Co2+ (110 nM and below), there is not enough time for formation of Co2+ within the plug in the small channels by the reaction in the first stage. Therefore, the input concentration of Co2+ is not amplified in the first stage and is further reduced upon merging and dilution. In this case, no response is observed in the second stage (blue symbols). Above a threshold initial concentration of Co2+ (280 nM and above), the reaction in the small droplets of the first stage takes place to produce enough Co2+ ions to trigger the reaction in the second stage, and a response is observed (red symbols). Reprinted with permission from reference [163]. Copyright 2004 American Chemical Society.

References

    1. Song H, Tice JD, Ismagilov RF. Angew Chem. 2003;115:792–796. Angew. Chem. Int. Ed. 2003, 42, 768–772. - PubMed
    1. Jähnisch K, Hessel V, Löwe H, Baerns M. Angew Chem. 2004;116:410–451. Angew. Chem. Int. Ed. 2004, 43, 406–446. - PubMed
    1. Dwars T, Paetzold E, Oehme G. Angew Chem. 2005;117:7338–7364. Angew. Chem. Int. Ed. 2005, 44, 7174–7199. - PubMed
    1. Watts P, Haswell SJ. Chem Soc Rev. 2005;34:235–246. - PubMed
    1. Watts P, Haswell SJ. Curr Opin Chem Biol. 2003;7:380–387. - PubMed

Publication types

MeSH terms

LinkOut - more resources