. 2007 Mar 1;402(2):291-300.
doi: 10.1042/BJ20060665.

Acetaldehyde dissociates the PTP1B-E-cadherin-beta-catenin complex in Caco-2 cell monolayers by a phosphorylation-dependent mechanism

Affiliations

Acetaldehyde dissociates the PTP1B-E-cadherin-beta-catenin complex in Caco-2 cell monolayers by a phosphorylation-dependent mechanism

Parimal Sheth et al. Biochem J. .

Abstract

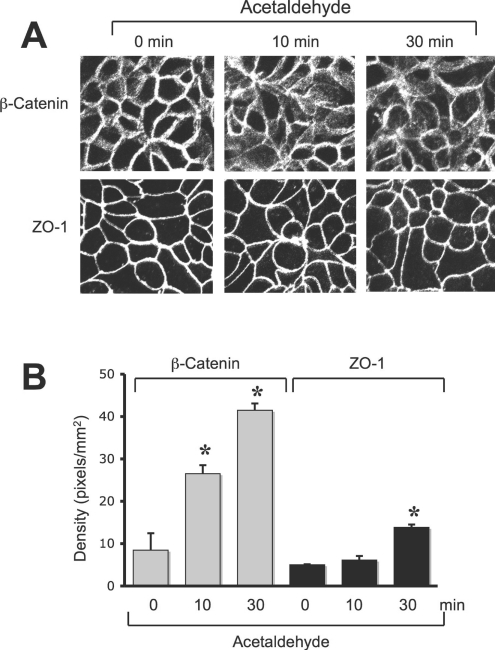
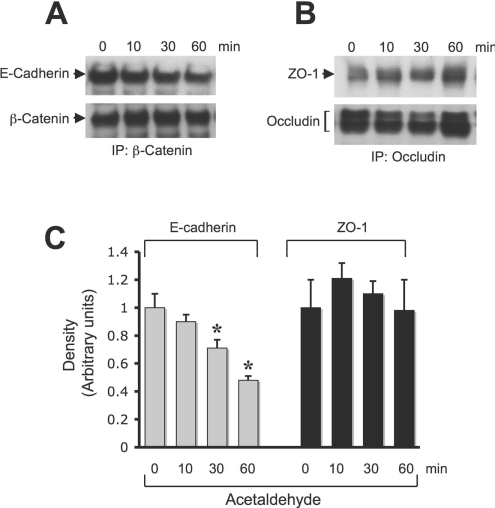
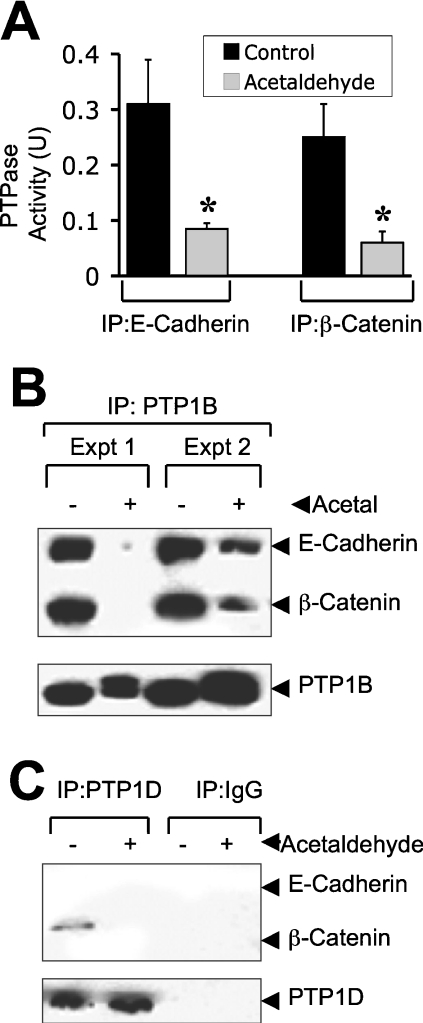
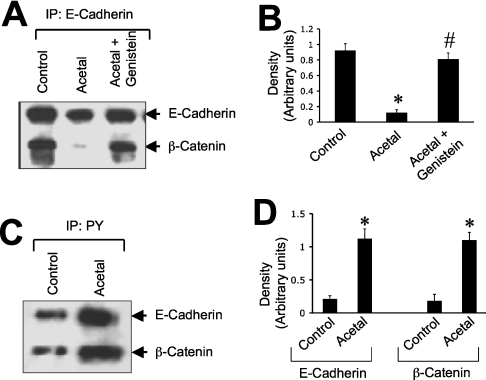
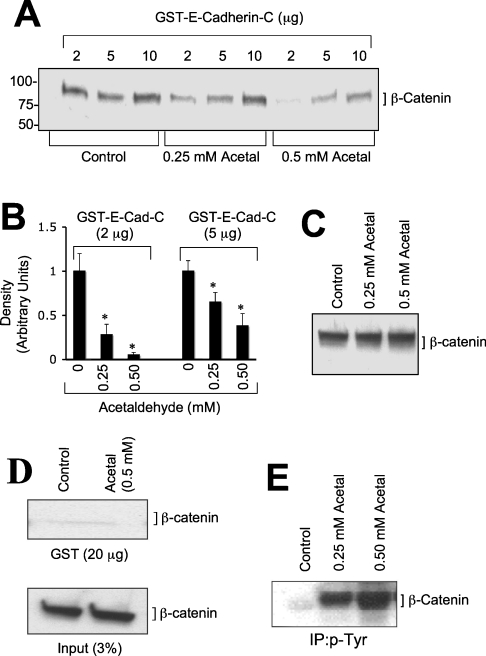
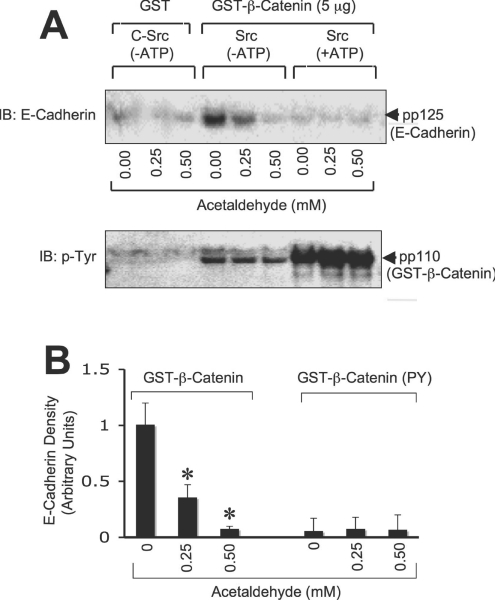
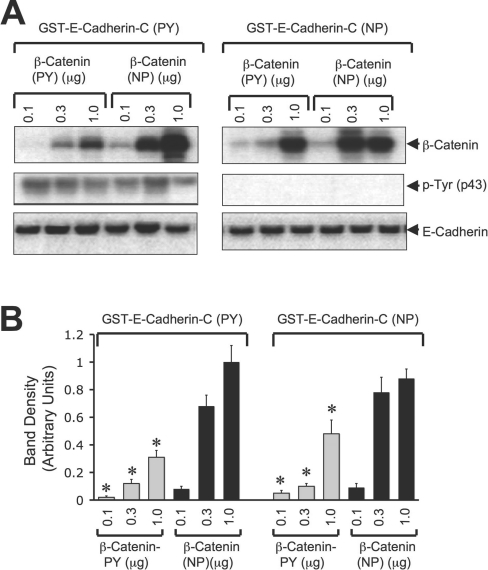
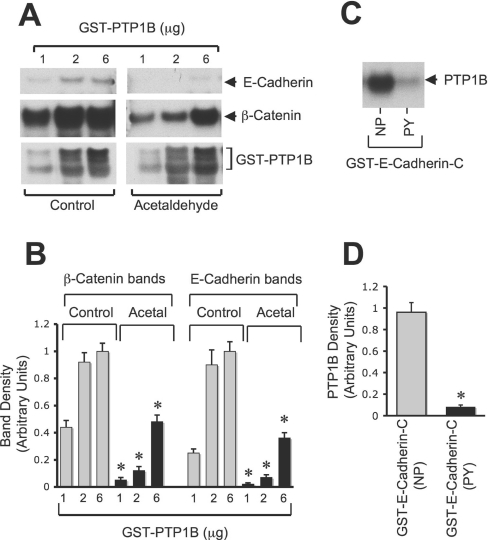
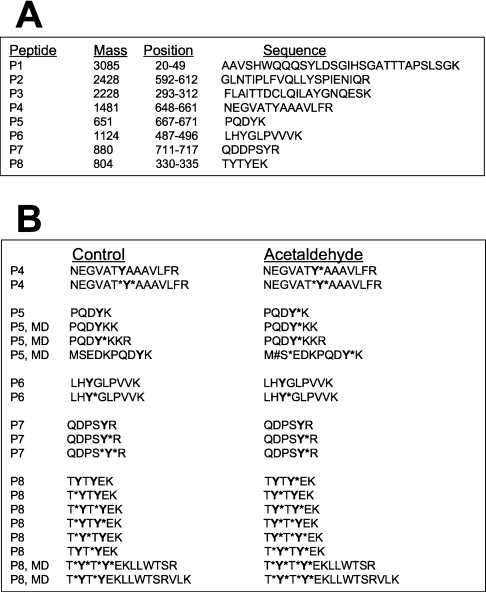
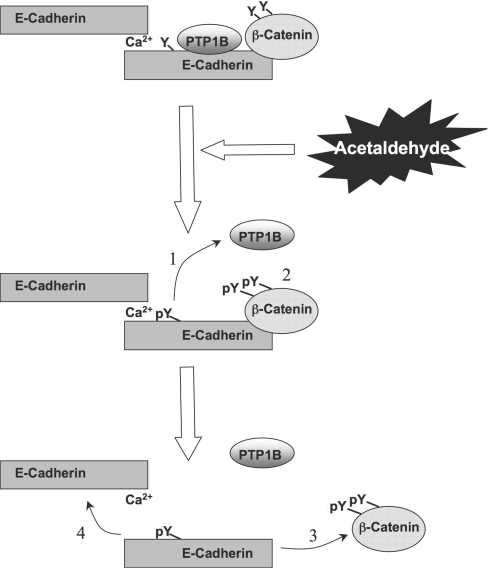
Interactions between E-cadherin, beta-catenin and PTP1B (protein tyrosine phosphatase 1B) are crucial for the organization of AJs (adherens junctions) and epithelial cell-cell adhesion. In the present study, the effect of acetaldehyde on the AJs and on the interactions between E-cadherin, beta-catenin and PTP1B was determined in Caco-2 cell monolayers. Treatment of cell monolayers with acetaldehyde induced redistribution of E-cadherin and beta-catenin from the intercellular junctions by a tyrosine phosphorylation-dependent mechanism. The PTPase activity associated with E-cadherin and beta-catenin was significantly reduced and the interaction of PTP1B with E-cadherin and beta-catenin was attenuated by acetaldehyde. Acetaldehyde treatment resulted in phosphorylation of beta-catenin on tyrosine residues, and abolished the interaction of beta-catenin with E-cadherin by a tyrosine kinase-dependent mechanism. Protein binding studies showed that the treatment of cells with acetaldehyde reduced the binding of beta-catenin to the C-terminal region of E-cadherin. Pairwise binding studies using purified proteins indicated that the direct interaction between E-cadherin and beta-catenin was reduced by tyrosine phosphorylation of beta-catenin, but was unaffected by tyrosine phosphorylation of E-cadherin-C. Treatment of cells with acetaldehyde also reduced the binding of E-cadherin to GST (glutathione S-transferase)-PTP1B. The pairwise binding study showed that GST-E-cadherin-C binds to recombinant PTP1B, but this binding was significantly reduced by tyrosine phosphorylation of E-cadherin. Acetaldehyde increased the phosphorylation of beta-catenin on Tyr-331, Tyr-333, Tyr-654 and Tyr-670. These results show that acetaldehyde induces disruption of interactions between E-cadherin, beta-catenin and PTP1B by a phosphorylation-dependent mechanism.


Figures

Figure 1
Figure 1. Acetaldehyde disrupts AJ and TJ
(A) Caco-2 cell monolayers were incubated with 400 μM acetaldehyde for various time periods. Cell monolayers were fixed in acetone/methanol and stained for β-catenin or ZO-1 by the immunofluorescence method. Fluorescence images were collected using a confocal microscope. (B) Fluorescence in the intracellular compartments was evaluated using Image J software. Values are means±S.E.M. (n=10). Asterisks indicate the values that are significantly (P<0.05) different from corresponding values for the 0 min group.
Figure 2
Figure 2. Acetaldehyde reduces co-immunoprecipitation of E-cadherin with β-catenin and ZO-1 with occludin
(A) Caco-2 cell monolayers were incubated with acetaldehyde for various time periods. Proteins were extracted under native conditions and β-catenin was immunoprecipitated. Immunocomplexes were then immunoblotted for β-catenin and E-cadherin. (B) Occludin was immunoprecipitated from protein extracts of cells exposed to acetaldehyde for various time periods followed by immunoblot analysis for ZO-1 and occludin. (C) Densitometric analysis. The density of the inverted bands was measured in terms of pixels/mm2. Values for density of E-cadherin and ZO-1 were normalized to the density value at 0 min for corresponding protein. Values are means±S.E.M. (n=3). Asterisks (*) indicate values that are significantly (P<0.05) different from the values for the corresponding 0 min time-point.
Figure 3
Figure 3. Acetaldehyde dissociates PTP1B from E-cadherin–β-catenin complex
Caco-2 cell monolayers were incubated with (Acetal) or without (Control) acetaldehyde (400 μM) for 5 h. (A) E-cadherin and β-catenin were immunoprecipitated from native protein extracts and assayed for PTPase activity. Values are means±S.E.M. (n=4). Asterisks indicate the values that are significantly (P<0.05) different from the corresponding control values. Control assay was conducted under similar conditions, but using pre-immune IgG instead of specific antibodies. These values were subtracted from values for anti-E-cadherin and anti-β-catenin immunocomplexes. (B) Following incubation of cells with or without acetaldehyde, PTP1B was immunoprecipitated and immunocomplexes were immunoblotted for E-cadherin, β-catenin and PTP1B. Samples from two different experiments were run in the above blot. (C) Following incubation with or without acetaldehyde, immunoprecipitation was conducted using anti-PTP1D antibody or pre-immune IgG. These immunocomplexes were immunoblotted for E-cadherin, β-catenin and PTP1D. Immunoprecipitation of occludin followed by immunoblot analysis for PTP1B showed no interaction of PTP1B with occludin (results not shown) and serves as a negative control.
Figure 4
Figure 4. Acetaldehyde disrupts the E-cadherin–β-catenin complex by a tyrosine kinase-dependent mechanism
Caco-2 cell monolayers were pre-incubated with or without genistein (100 μM) for 1 h prior to incubation with (Acetal) or without (Control) 400 μM acetaldehyde for 5 h. (A) E-cadherin from native protein extracts was immunoprecipitated followed by immunoblot analysis for β-catenin and E-cadherin. (B) Densitometric analysis of β-catenin bands in (A). The ratio of density of β-catenin bands to density of E-cadherin bands is presented. Values are means±S.E.M. from three independent experiments. Asterisk and ‘#’ indicate the values that are significantly (P<0.05) different from the values for control and acetaldehyde groups respectively. (C) Denatured protein extracts from control and acetaldehyde-treated cells were immunoprecipitated for p-Tyr followed by immunoblot analysis for E-cadherin and β-catenin. (D) Densitometric analysis of E-cadherin and β-catenin bands in (C). Values are means±S.E.M. from three independent experiments. Asterisks indicate the values that are significantly (P<0.05) different from the values for the corresponding control group.
Figure 5
Figure 5. Acetaldehyde prevents β-catenin binding to the C-terminal region of E-cadherin
(A) Different concentrations of GST–E-cadherin-C (C-terminal 151 amino acids of human E-cadherin) were incubated at 4 °C for 16 h with detergent-soluble protein extracts from Caco-2 cells that were pre-incubated with or without (control) different concentrations of acetaldehyde. GSH–agarose pull-down was immunoblotted for β-catenin. (B) Densitometric analyses of β-catenin bands in (A). Values are means±S.E.M. (n=3). Asterisks indicate the values that are significantly different (P<0.05) from the corresponding control values. (C) Total protein extracts from Caco-2 cells (3% of that used for GST pull-down assay in A) were immunoblotted for β-catenin. (D) GST (20 μg) was incubated for 16 h at 4 °C with detergent-soluble protein extracts from control or acetaldehyde-treated cells. GSH–agarose pull-down and the protein extracts were immunoblotted for β-catenin. (E) p-Tyr was immunoprecipitated from denatured protein extracts from Caco-2 cells that were incubated with or without (control) different concentrations of acetaldehyde and immunocomplexes were immunoblotted for β-catenin.
Figure 6
Figure 6. Acetaldehyde prevents E-cadherin binding to GST–β-catenin
(A) GST–β-catenin, non-phosphorylated or tyrosine-phosphorylated by c-Src, was incubated at 4 °C for 16 h with detergent-soluble protein extracts from Caco-2 cells that were pre-incubated with or without different concentrations of acetaldehyde. GSH–agarose pull-down was immunoblotted for E-cadherin. Lower panel: immunoblot analysis of the same experiment for p-Tyr showing tyrosine phosphorylation of GST–β-catenin where it was incubated with c-Src in the presence of ATP. (B) Densitometric analyses of E-cadherin bands in (A). Values are means±S.E.M. (n=3). Asterisks indicate the values that are significantly different (P<0.05) from the corresponding control values.
Figure 7
Figure 7. Direct interaction between β-catenin and the C-terminal region of E-cadherin is attenuated by tyrosine phosphorylation
(A) Non-phosphorylated (NP) GST–E-cadherin-C (incubated with c-Src in the absence of ATP) or tyrosine-phosphorylated (PY) GST–E-cadherin-C (incubated with c-Src in the presence of ATP) (0.3 μg) was incubated with varying concentrations of thrombin-cleaved non-phosphorylated or tyrosine-phosphorylated β-catenin. GSH–agarose pull-down was immunoblotted for β-catenin, p-Tyr and E-cadherin. (B) Experiments in (A) were repeated twice and β-catenin bands were evaluated by densitometric analysis. Density values were normalized to the corresponding values for E-cadherin bands and one of the values for binding between GST–E-cadherin-C (NP) and 1 μg of β-catenin (NP). Values are means±S.E.M. (n=3). Asterisks indicate the values that are significantly (P<0.05) different from the corresponding values for β-catenin (NP).
Figure 8
Figure 8. Acetaldehyde dissociates interaction of E-cadherin with PTP1B
(A) Various concentrations of GST–PTP1B were incubated with cell extracts from untreated (Control) or acetaldehyde-treated (Acetal) cell monolayers as described in the Experimental section. GSH–agarose pull-down was immunoblotted for E-cadherin, β-catenin and PTP1B. (B) β-Catenin and E-cadherin bands in experiments in (A) were evaluated by densitometric analysis. Density values were normalized to one of the values for the corresponding control at 6 μg of PTP1B. Values are means±S.E.M. (n=3). Asterisks indicate the values that are significantly (P<0.05) different from the corresponding values for Control. (C) Incubation of 2 μg of non-phosphorylated (NP) or tyrosine-phosphorylated (PY) GST–E-cadherin-C with thrombin-cleaved PTP1B (0.25 μg) was performed. GSH–agarose pull-down was immunoblotted for PTP1B. (D) PTP1B bands in (C) were evaluated by densitometric analysis. Density values were normalized to one of the values for GST–E-cadherin-C (NP). Values are means±S.E.M. (n=3). The asterisk indicates the values that are significantly (P<0.05) different from the corresponding value for NP.
Figure 9
Figure 9. Sequest analysis of ion fragmentation spectra from trypsin fragments of β-catenin from control and acetaldehyde-treated cells
Caco-2 cells were incubated for 5 h with or without 400 μM acetaldehyde. β-Catenin in proteins extracted under denaturing conditions was immunoprecipitated and separated by SDS/PAGE. The gel was stained with Coomassie Blue. The protein band corresponding to a 92 kDa protein was excised and subjected to in-gel trypsin digestion followed by LC/MS/MS analysis. Sequences of β-catenin fragments were determined by Sequest analysis of ion fragmentation spectra for different peptides. (A) The masses of tyrosine-containing trypsin fragments of β-catenin were determined by using ExPASy's peptide mass software. (B) Variants of each peptide formed due to phosphorylation of a serine or threonine residue (S*, T*), misdigestion (MD) by trypsin and methionine oxidation (M#) are listed. Residue with an asterisk on its right indicates that the residue is phosphorylated.
Figure 10
Figure 10. Diagrammatic model showing acetaldehyde-induced loss of interaction between PTP1B–E-cadherin–β-catenin
Cadherin-based cell–cell adhesion is mediated by interaction of E-cadherin with β-catenin. PTP1B binds to the intracellular domain of E-cadherin and dephosphorylates β-catenin on tyrosine residues. Treatment of cell monolayers with acetaldehyde induces inhibition and dissociation of PTP1B from E-cadherin (1), which results in increased tyrosine phosphorylation of β-catenin and E-cadherin (2). Tyrosine phosphorylation of β-catenin results in the loss of its interaction with E-cadherin (3), and loss of interaction between E-cadherin and β-catenin leads to a loss of homophilic interaction between extracellular domains of E-cadherin (4).

References

    1. Salaspuro M. P. Acetaldehyde, microbes, and cancer of the digestive tract. Crit. Rev. Clin. Lab. Sci. 2003;40:183–208. - PubMed
    1. Homann N., Tillonen J., Meurman J. H., Rintamaki H., Lindqvist C., Rautio M., Jousimies-Somer H., Salaspuro M. Increased salivary acetaldehyde levels in heavy drinkers and smokers: a microbiological approach to oral cavity cancer. Carcinogenesis. 2000;21:663–668. - PubMed
    1. Visapaa J. P., Tillonen J., Salaspuro M. Microbes and mucosa in the regulation of intracolonic acetaldehyde concentration during ethanol challenge. Alcohol Alcohol. 2002;37:322–326. - PubMed
    1. Poschl G., Seitz H. K. Alcohol and cancer. Alcohol Alcohol. 2004;39:155–165. - PubMed
    1. Salaspuro M. Bacteriocolonic pathway for ethanol oxidation: characteristics and implications. Ann. Med. 1996;28:195–200. - PubMed

Publication types

MeSH terms