. 2007 Jan;9(1):68-86.
doi: 10.1016/j.ymben.2006.09.001. Epub 2006 Sep 17.

Elementary metabolite units (EMU): a novel framework for modeling isotopic distributions

Affiliations

Elementary metabolite units (EMU): a novel framework for modeling isotopic distributions

Maciek R Antoniewicz et al. Metab Eng. 2007 Jan.

Abstract

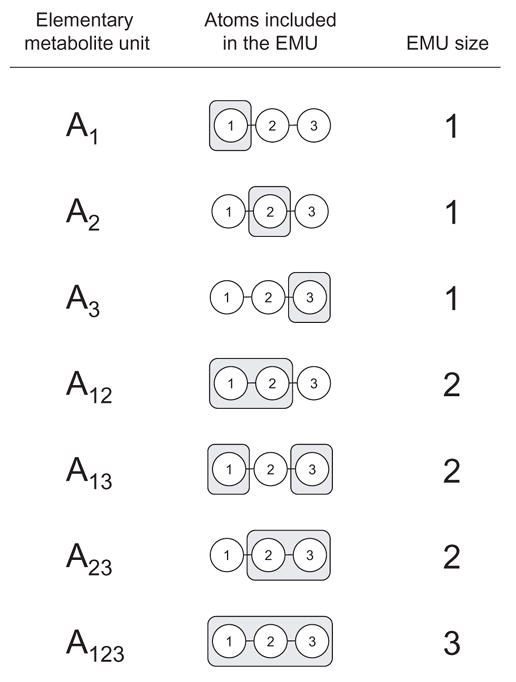
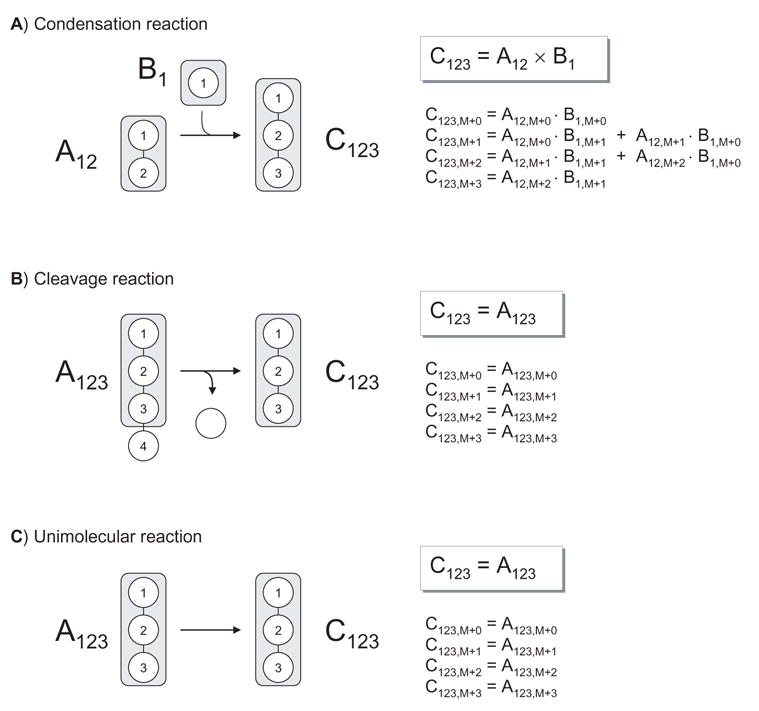
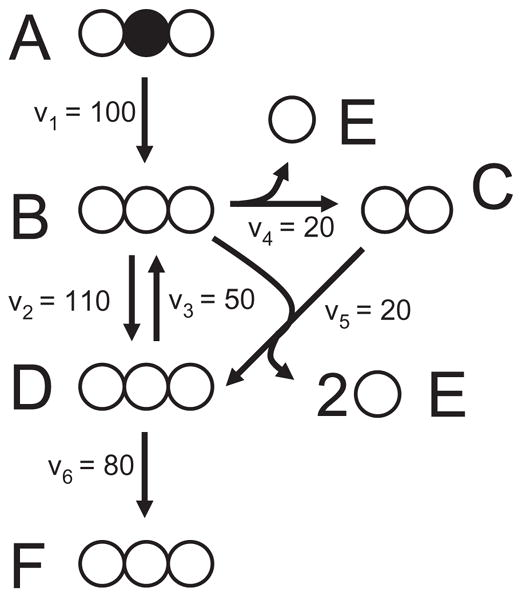
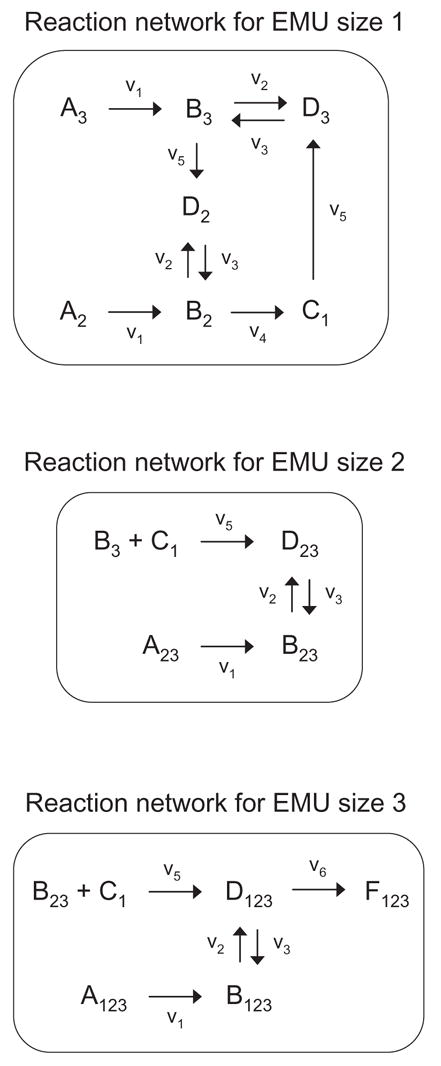
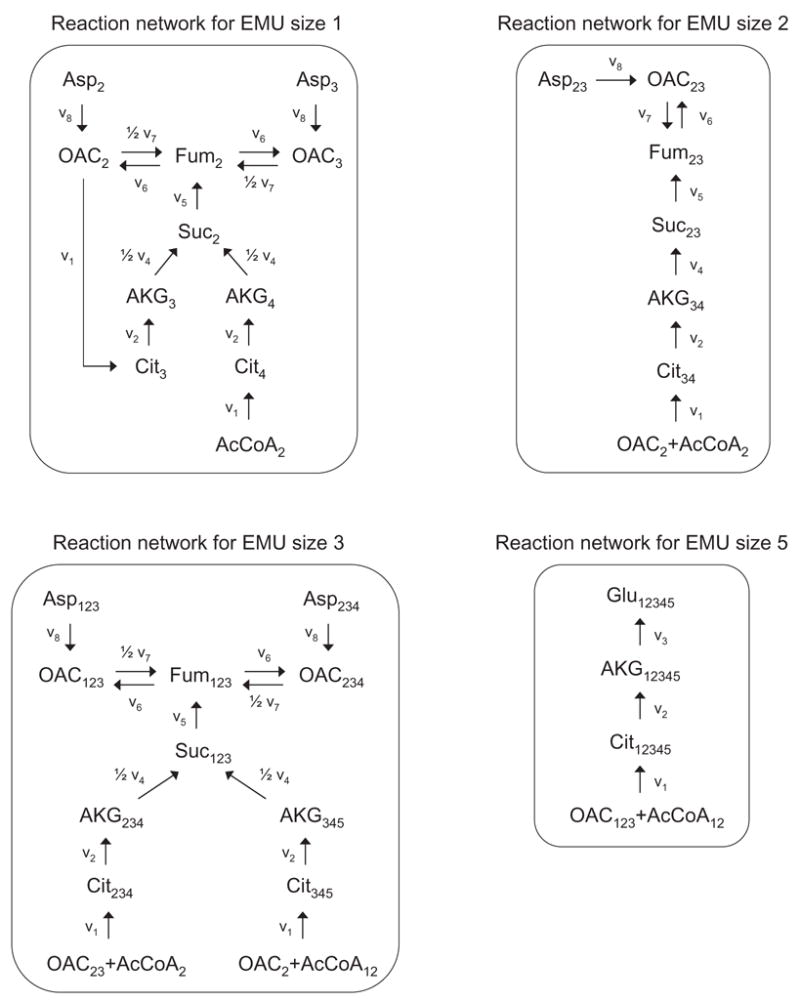
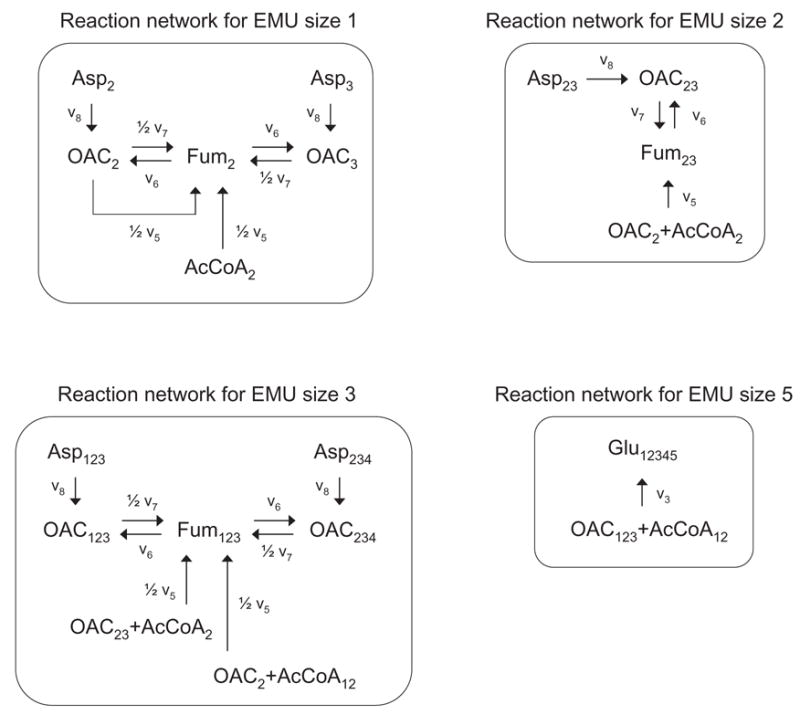
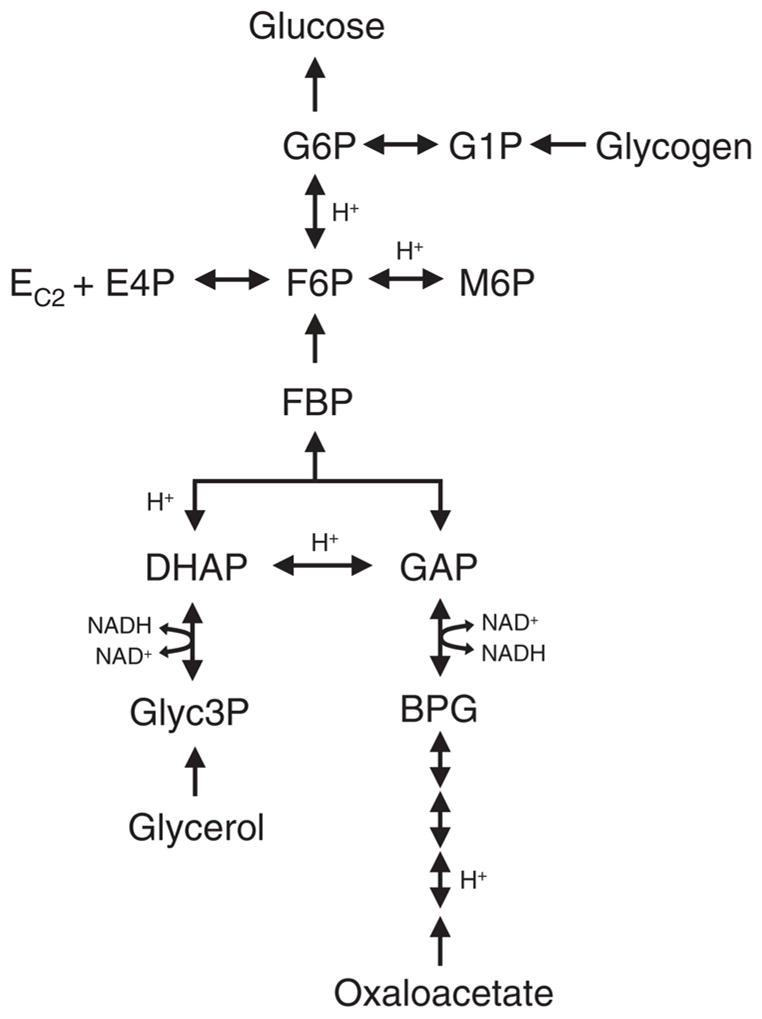
Metabolic flux analysis (MFA) has emerged as a tool of great significance for metabolic engineering and mammalian physiology. An important limitation of MFA, as carried out via stable isotope labeling and GC/MS and nuclear magnetic resonance (NMR) measurements, is the large number of isotopomer or cumomer equations that need to be solved, especially when multiple isotopic tracers are used for the labeling of the system. This restriction reduces the ability of MFA to fully utilize the power of multiple isotopic tracers in elucidating the physiology of realistic situations comprising complex bioreaction networks. Here, we present a novel framework for the modeling of isotopic labeling systems that significantly reduces the number of system variables without any loss of information. The elementary metabolite unit (EMU) framework is based on a highly efficient decomposition method that identifies the minimum amount of information needed to simulate isotopic labeling within a reaction network using the knowledge of atomic transitions occurring in the network reactions. The functional units generated by the decomposition algorithm, called EMUs, form the new basis for generating system equations that describe the relationship between fluxes and stable isotope measurements. Isotopomer abundances simulated using the EMU framework are identical to those obtained using the isotopomer and cumomer methods, however, require significantly less computation time. For a typical (13)C-labeling system the total number of equations that needs to be solved is reduced by one order-of-magnitude (100s EMUs vs. 1000s isotopomers). As such, the EMU framework is most efficient for the analysis of labeling by multiple isotopic tracers. For example, analysis of the gluconeogenesis pathway with (2)H, (13)C, and (18)O tracers requires only 354 EMUs, compared to more than two million isotopomers.


Figures

Figure 1
Figure 1
Elementary metabolite units (EMU) are distinct subsets of the compound’s atoms. There are 7 EMUs for a 3-atom metabolite A. The subscript in the first column and the shaded areas in the second column denote the atoms that are included in the EMU. The EMU size is the number of atoms included in the EMU.
Figure 2
Figure 2
Three types of biochemical reactions with the corresponding EMU reactions. Shaded areas indicate atoms included in the EMUs. The mass isotopomer distribution (MID) of product C is fully determined by MIDs of substrate EMUs. For the condensation reaction, MID of C123 is obtained from the convolution (or Cauchy product, denoted by ‘×’) of MIDs of A12 and B1. For the cleavage reaction and unimolecular reaction MID of C123 equals MID of A123.
Figure 3
Figure 3
Simple metabolic network used to illustrate the decomposition of a metabolic network into EMU reactions. Atom transitions for the reactions in this model are given in Table 2. The assumed steady-state fluxes have arbitrary units and the network substrate A is labeled on the second atom.
Figure 4
Figure 4
Decoupled EMU reaction networks generated for the simulation of metabolite F. Note that the EMU reaction networks contain only these EMUs that are strictly required to simulate F.
Figure 5
Figure 5
A schematic of the algorithm for simulating labeling distributions and calculating sensitivities from EMU balances. EMU balances are solved sequentially starting with the smallest EMU-size networks up to the largest EMU-size network. The simulated measurements and sensitivities are extracted from matrices X and dX/dv, respectively.
Figure 6
Figure 6
Stereospecific atom transitions for the reaction catalyzed by aconitese. Aconitase stereospecifically transfers the pro-R hydrogen from the pro-R arm of citrate to C3 of isocitrate, and produces only one of four possible stereoisomers of isocitrate, i.e. (2R,3S)-isocitrate.
Figure 7
Figure 7
Six equivalent EMUs of pyruvate. Three hydrogen atoms of pyruvate at C3 are biochemically equivalent, and two oxygen atoms at C1 are equivalent due to resonance stabilization. As such, there are six equivalent EMUs of pyruvate containing all three carbon atoms, two of the three hydrogen atoms at C3, and one of two oxygen atom at C1. Shaded areas indicate atoms that are included in the EMUs.
Figure 8
Figure 8
Malic enzyme converts malate to pyruvate. Note that one of the three hydrogen atoms at C#6 of pyruvate is derived from the solvent. The two prochiral hydrogen atoms of malate at C#7, which are biochemically distinct, become indistinguishable after malate is converted to pyruvate.
Figure 9
Figure 9
Differences between molecules with a rotation axis and center of inversion. (2S,3R)-Butane-1,2,3,4-tetraol (i.e. erythritol) has a center of inversion and is not superposable on itself. Thus, carbon atoms C1 and C4, and C2 and C3 of erythritol are biochemically distinct. (2R,3R)-Butane-1,2,3,4-tetraol, on the other hand, has a rotation axis and is superposable on itself. Hence, carbon atoms C1 and C4, and C2 and C3 are biochemically indistinguishable, resulting in scrambling of isotopic labeling.
Figure 10
Figure 10
Equivalent EMUs of fumarate, a rotationally symmetric molecule. The following four EMUs are equivalent: Fum12467, Fum13467, Fum45689, and Fum4568,10 (numbering of fumarate atoms is arbitrary). Shaded areas indicate atoms included in the EMUs.
Figure 11
Figure 11
A schematic of the algorithm for the decomposition of metabolic networks into decoupled EMU networks. This algorithm systematically identifies the minimal set of EMU reactions that are needed for the simulation model. The algorithm is exhaustive, unsupervised, and computationally efficient.
Figure 12
Figure 12
Simplified model of the tricarboxylic acid cycle. Abbreviations of metabolites: OAC, oxaloacetate; Asp, aspartate; AcCoA, acetyl coenzyme A; Cit, citrate; AKG, α-ketoglutarate; Glu, glutamate; Suc, succinate. The assumed fluxes have arbitrary units.
Figure 13
Figure 13
EMU reaction networks generated for glutamate from EMU network decomposition of the TCA cycle. The complete molecule of glutamate corresponds to EMU Glu12345. Subscripts denote carbon atoms that are included in the EMUs. Abbreviations of metabolites are same as in Figure 12.
Figure 14
Figure 14
Simplified EMU reaction networks for glutamate. The EMU networks from Figure 13 were reduced by lumping linear EMU nodes having only one influx. Abbreviations of metabolites are same as in Figure 12.
Figure 15
Figure 15
Reactions of the gluconeogenesis pathway used to simulate the labeling of glucose.

References

    1. Anderson DH. Compartmental modeling and tracer kinetics. Springer-Verlag; New York: 1983.
    1. Antoniewicz MR, Kelleher JK, Stephanopoulos G. Determination of confidence intervals of metabolic fluxes estimated from stable isotope measurements. Metab Eng. 2006;8:324–337. - PubMed
    1. Brunengraber H, Kelleher JK, Des RC. Applications of mass isotopomer analysis to nutrition research. Annu Rev Nutr. 1997;17:559–596. - PubMed
    1. Hellerstein MK. In vivo measurement of fluxes through metabolic pathways: the missing link in functional genomics and pharmaceutical research. Annu Rev Nutr. 2003;23:379–402. - PubMed
    1. Moss GP. Basic terminology of stereochemistry. Pure Appl Chem. 1996;68:2193–2222.

Publication types