Comparative Study
. 2006 Nov 9;52(3):475-84.
doi: 10.1016/j.neuron.2006.08.034.

Arc/Arg3.1 mediates homeostatic synaptic scaling of AMPA receptors

Affiliations
Comparative Study

Arc/Arg3.1 mediates homeostatic synaptic scaling of AMPA receptors

Jason D Shepherd et al. Neuron. .

Abstract

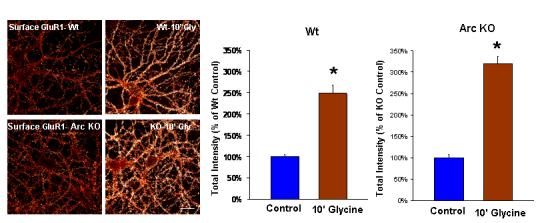
Homeostatic plasticity may compensate for Hebbian forms of synaptic plasticity, such as long-term potentiation (LTP) and depression (LTD), by scaling neuronal output without changing the relative strength of individual synapses. This delicate balance between neuronal output and distributed synaptic weight may be necessary for maintaining efficient encoding of information across neuronal networks. Here, we demonstrate that Arc/Arg3.1, an immediate-early gene (IEG) that is rapidly induced by neuronal activity associated with information encoding in the brain, mediates homeostatic synaptic scaling of AMPA type glutamate receptors (AMPARs) via its ability to activate a novel and selective AMPAR endocytic pathway. High levels of Arc/Arg3.1 block the homeostatic increases in AMPAR function induced by chronic neuronal inactivity. Conversely, loss of Arc/Arg3.1 results in increased AMPAR function and abolishes homeostatic scaling of AMPARs. These observations, together with evidence that Arc/Arg3.1 is required for memory consolidation, reveal the importance of Arc/Arg3.1's dynamic expression as it exerts continuous and precise control over synaptic strength and cellular excitability.


Figures

Figure 1
Figure 1
Arc Protein is Dynamically Regulated by Neuronal Activity in Primary Culture.(A)Endogenous Arc is expressed in the cell body and dendrites of DIV 28 primary hippocampal neurons. There is enrichment of protein at synapses, as shown by colocalization with the presynaptic marker bassoon. (Scale bars represent 30μm and 8 μm in magnified dendrites.) (B)Representative pictures of Arc protein in DIV 28 primary cortical neurons. Arc protein is downregulated after 2 days of TTX treatment, and is conversely upregulated with 2 days of bicuculline treatment. (Pictures are shown using a Glow scale, with white as the highest pixel intensity and red as the lowest intensity. Scale bar, 80μm) (C)Quantification of protein levels in cortical neurons shows a significant downregulation with TTX treatment (n = 41 cells) as compared with untreated neurons (n = 38) and a significant upregulation with bicculline treatment (n = 48). (*p < 0.05)
Figure 2
Figure 2
Arc Over-expression Blocks TTX-induced Synaptic Scaling(A)Representative images of Arc transgene expression in low-density hippocampal neurons, showing a reduction of surface GluR1 as compared to neighboring untransfected cells, 16 hours post-transfection. Treatment with TTX enhanced surface GluR1, which was blocked by expression of Arc transgene. (White boxes show magnified Arc transfected dendrites and yellow boxes highlight untransfected (B) Quantification of surface GluR1 experiments. Results from one experiment are shown and is representative of data collected from at least 2 other experiments. Arc expression causes a significant decrease in the total intensity of surface GluR1 puncta (64 ± 5% of untransfected cells, n = 42 dendritic regions from 14 cells) compared with neighboring untransfected cells (n = 42/14). TTX treatment significantly enhanced GluR1 Intensity (136±10%, n = 42/14 Arc expression blocked the TTX-induced increase in surface GluR1 (46 ± 3%, n = 42/14). (*p ≪ 0.001) (C) Western blots of primary high density cortical cultures show that Arc Sindbis virus expression has no affect on surface GluR1 or 2 with no treatment, but dramatically reduced surface levels when treated with TTX, blocking the upregulation observed in cells transfected with GFP virus. (D)Traces selected from recordings of untransfected, GFP+Wt-Arc or GFP+Δ91-100Arc transfected neurons. Histograms represent the average mEPSC amplitude of each population. No change in amplitude or frequency was observed (Scale = 20 pA, 400 ms) (E) Traces selected from whole-cell recordings of untransfected GFP+Wt-Arc or GFP+Δ91-100Arc expressing neurons. In each case, neurons were treated with TTX for 48 hours. mEPSCS were only downregulated in Wt-Arc expressing neurons (*p < 0.05) (F) Left, Cumulative probability distribution of mEPSC amplitudes from all events in either untransfected (U; n=2597) or GFP+ARC (G+A; n=2450) transfected neurons. Right, Cumulative probability distribution of mEPSC amplitudes from all events in either untransfected (U; n=1540) or GFP+ARC (G+U; n=1476) transfected neurons. These neurons were treated with 1 μM TTX for 48 hours.
Figure 3
Figure 3
Surface GluR1 and Synaptic Strength are Increased in Arc KO Mice(A)Representative pictures of surface GluR1 in Wt and KO primary hippocampal neurons. Arc KO neurons (n = 60/20) have significantly increased surface levels compared to Arc Wt neurons (n = 54/18). Similar results are reported in Figure 8A of Chowdhury et al, although the results reported reflect two different experiments (* p<0.001). (B) Representative pictures of surface GluR2 in Wt and KO primary hippocampal neurons. No significant difference in surface GluR2 levels was observed (p = 0.2). (Scale bar, 30μm) (C) Western blots of synaptic proteins in Wt and Arc KO neurons obtained from total and P2 fractionated brain lysates, showing no dramatic changes in protein expression. (D)Traces selected from recordings of either Wt (n = 23) or Arc KO (n = 21) neurons. Histograms represent the average mEPSC amplitude or frequency of each population. Arc KO neurons have significantly higher mEPSC amplitudes (*p<0.01). (Scale = 30 pA, 100 ms). Cumulative probability distribution of mEPSC amplitudes from all events in either Wt (n = 2454) or ARC KO (n = 2222) neurons are shown.
Figure 4
Figure 4
Synaptic Scaling of AMPARs is Abolished in Arc KO Neurons(A)Representative images of surface GluR1 in Wt and KO neurons treated for 2 days with TTX or bicuculline. Wt neurons undergo significant scaling, with an increase in surface levels with TTX and a decrease in surface levels with bicuculline treatment.In contrast KO neurons do not exhibit any changes in surface levels. (Scale bar, 30μm).Quantification of surface levels show that Wt neurons have a significant decrease in total intensity (n = 30/11 for all) with TTX treatment and a significant increase in intensity with bicuculline treatment. In contrast no significant difference in surface GluR1 intensity was observed in KO neurons treated with TTX (p = 0.5) or bicuculline (p = 0.5). (*p<0.001) (B) Top, Representative mEPSC (averaged;∼100 events) from a control (n = 9), TTX (1 μM; 48 hrs; n = 9), or bicucullineBottom, Histograms represent the average mEPSC amplitude or frequency of each population. mEPSC amplitudes are significantly higher after TTX treatment (*p<0.05). (Scale = 10 pA, 5 ms.). Right, Cumulative probability distribution of mEPSC amplitudes from all events in control, TTX, and bicuculline treated Wt neurons. (C) Top, Representative mEPSC (averaged;∼100 events) from a control (n = 15), TTX (1 mM; 48 hrs; n=15), or bicuculline (20 mM; 48 hrs; n=10) treated Arc KO mouse neuron. Histograms represent the average mEPSC amplitude or frequency of each population. In contrast to Wt neurons TTX treatment does not result in an increase in mEPSC amplitude. (Scale = 10 pA, 5 ms). Right, Cumulative probability distribution of mEPSC amplitudes from all events in control, TTX, and bicuculline treated KO neurons. Virtually no scaling of amplitudes can be observed in KO neurons.
Figure 5
Figure 5
Arc KO Neurons Exhibit Normal Insertion of GluR1 Immediately after Chemical LTPRepresentative pictures of surface GluR1 in cultures treated with Glycine. Although Arc KO neurons have higher basal surface GluR1, pictures were obtained to equalize Wt and KO basal levels so as to directly compare changes induced with glycine treatment. Quantitation of surface GluR1 shows that both Wt and KO neurons showed robust and significant increases in surface levels 10 minutes after glycine treatment (*p ≪ 0.001).

Similar articles

Cited by

References

    1. Banker GA, Cowan WM. Rat hippocampal neurons in dispersed cell culture. Brain Res. 1977;126:397–342. - PubMed
    1. Blackstone CD, Moss SJ, Martin LJ, Levey AI, Price DL, Huganir RL. Biochemical characterization and localization of a non-N-methyl-D-aspartate glutamate receptor in rat brain. J Neurochem. 1992;58:1118–1126. - PubMed
    1. Burke SN, Chawla MK, Penner MR, Crowell BE, Worley PF, Barnes CA, McNaughton BL. Differential encoding of behavior and spatial context in deep and superficial layers of the neocortex. Neuron. 2005;45:667–674. - PubMed
    1. Chowdhury S, Shepherd JD, Okuno H, Lyford G, Petralia RS, Plath N, Kuhl D, Huganir RL, Worley PF. Arc interacts with the endocytic machinery to regulate AMPA receptor trafficking. 2006 In Press. - PMC - PubMed
    1. Davis GW, Bezprozvanny I. Maintaining the stability of neural function: a homeostatic hypothesis. Annu Rev Physiol. 2001;63:847–869. - PubMed

Publication types

MeSH terms