

Structural and functional MRI reveals multiple retinal layers
- PMID: 17088544
- PMCID: PMC1859962
- DOI: 10.1073/pnas.0605790103
Structural and functional MRI reveals multiple retinal layers
Abstract
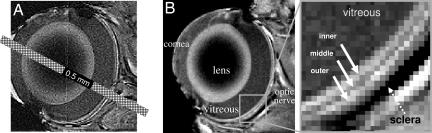
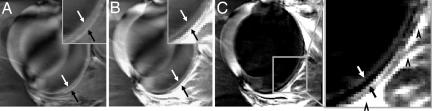
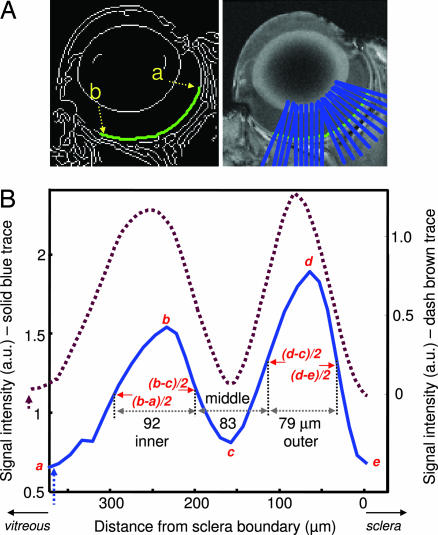
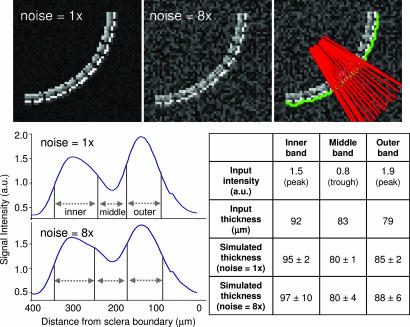
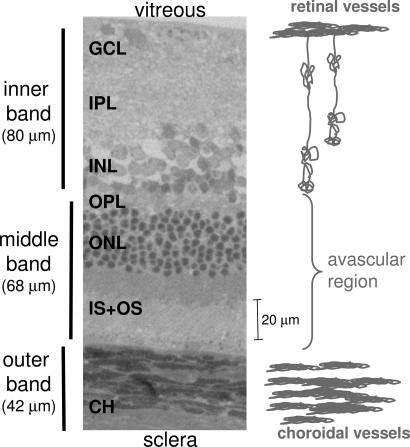
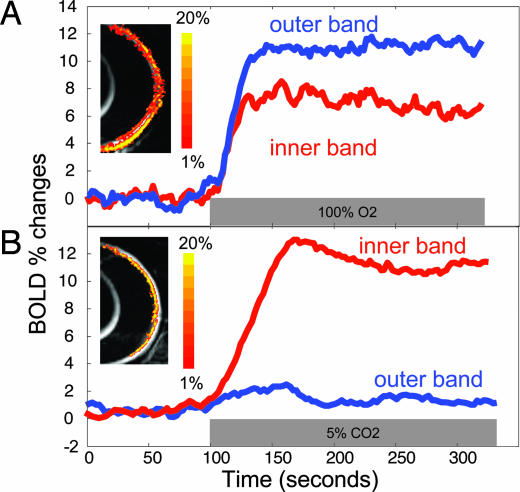
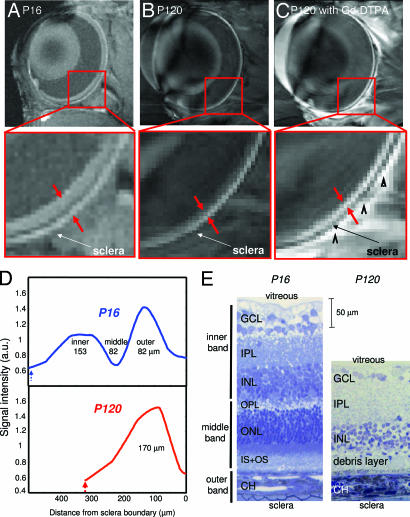
MRI is a noninvasive diagnostic modality that reveals anatomy, physiology, and function in vivo without depth limitation or optical interference. MRI application to the retina, however, remains challenging. We improved spatial resolution to resolve layer-specific structure and functional responses in the retina and confirmed the laminar resolution in an established animal model of retinal degeneration. Structural MRI of normal rat retinas revealed three bands corresponding histologically to (i) the combined ganglion cell layer/inner nuclear layer plus the embedded retinal vessels, (ii) the avascular outer nuclear (photoreceptor) layer and its photoreceptor segments, and (iii) the choroidal vascular layer. Imaging with an intravascular contrast agent (gadolinium-diethylene-tri-amine-pentaacetic acid) enhanced the retinal and choroidal vascular layers bounding the retina, but not the avascular outer nuclear layer and the vitreous. Similarly, blood-oxygen-level-dependent (BOLD) functional MRI revealed layer-specific responses to hyperoxia and hypercapnia. Importantly, layer-specific BOLD responses in the two vascular layers were divergent, suggesting the two vasculatures are differentially regulated. To corroborate sensitivity and specificity, we applied layer-specific MRI to document photoreceptor degeneration in Royal College of Surgeons rats. Consistent with histology, layer-specific MRI detected degeneration of the outer nuclear layer. Surprisingly, MRI revealed increased thickness in the choroidal vascular layer and diminished BOLD responses to hyperoxia and hypercapnia in the Royal College of Surgeons rat retinas, suggesting perturbation of vascular reactivity secondary to photoreceptor loss. We conclude that MRI is a powerful investigative tool capable of resolving lamina-specific structures and functional responses in the retina as well as probing lamina-specific changes in retinal diseases.
Conflict of interest statement
The authors declare no conflict of interest.
Figures
Similar articles
-
Manganese-enhanced MRI reveals multiple cellular and vascular layers in normal and degenerated retinas.J Magn Reson Imaging. 2011 Dec;34(6):1422-9. doi: 10.1002/jmri.22719. Epub 2011 Sep 30. J Magn Reson Imaging. 2011. PMID: 21964629 Free PMC article.
-
MRI reveals differential regulation of retinal and choroidal blood volumes in rat retina.Neuroimage. 2011 Jan 15;54(2):1063-9. doi: 10.1016/j.neuroimage.2010.09.020. Epub 2010 Sep 17. Neuroimage. 2011. PMID: 20850550 Free PMC article.
-
Lamina-specific functional MRI of retinal and choroidal responses to visual stimuli.Invest Ophthalmol Vis Sci. 2011 Jul 15;52(8):5303-10. doi: 10.1167/iovs.10-6438. Invest Ophthalmol Vis Sci. 2011. PMID: 21447679 Free PMC article.
-
Oxygen distribution and consumption within the retina in vascularised and avascular retinas and in animal models of retinal disease.Prog Retin Eye Res. 2001 Mar;20(2):175-208. doi: 10.1016/s1350-9462(00)00027-6. Prog Retin Eye Res. 2001. PMID: 11173251 Review.
-
Retinal degeneration and local oxygen metabolism.Exp Eye Res. 2005 Jun;80(6):745-51. doi: 10.1016/j.exer.2005.01.018. Exp Eye Res. 2005. PMID: 15939030 Review.
Cited by
-
Risk factors for poor outcomes in patients with open-globe injuries.Clin Ophthalmol. 2016 Aug 1;10:1461-6. doi: 10.2147/OPTH.S108901. eCollection 2016. Clin Ophthalmol. 2016. PMID: 27536059 Free PMC article.
-
Age-related reduction in retinal deimination levels in the F344BN rat.Aging Cell. 2008 Jun;7(3):441-4. doi: 10.1111/j.1474-9726.2008.00376.x. Epub 2008 Jan 31. Aging Cell. 2008. PMID: 18248664 Free PMC article.
-
Temporal statistical analysis of laser speckle images and its application to retinal blood-flow imaging.Opt Express. 2008 Jul 7;16(14):10214-9. doi: 10.1364/oe.16.010214. Opt Express. 2008. PMID: 18607429 Free PMC article.
-
Balanced steady state free precession for arterial spin labeling MRI: Initial experience for blood flow mapping in human brain, retina, and kidney.Magn Reson Imaging. 2013 Sep;31(7):1044-50. doi: 10.1016/j.mri.2013.03.024. Epub 2013 May 8. Magn Reson Imaging. 2013. PMID: 23664680 Free PMC article.
-
Magnetic resonance imaging of the retina: from mice to men.Magn Reson Med. 2014 Apr;71(4):1526-30. doi: 10.1002/mrm.24797. Epub 2013 May 28. Magn Reson Med. 2014. PMID: 23716429 Free PMC article. Review.
References
Publication types
MeSH terms
Grants and funding
LinkOut - more resources
Full Text Sources
