

doi: 10.1105/tpc.106.042267.
A brief history of systems biology. "Every object that biology studies is a system of systems." Francois Jacob (1974)
Affiliations
- PMID: 17088606
- PMCID: PMC1626627
- DOI: 10.1105/tpc.106.042267
Item in Clipboard
A brief history of systems biology. "Every object that biology studies is a system of systems." Francois Jacob (1974)
Plant Cell.
2006 Oct.
No abstract available
Figures
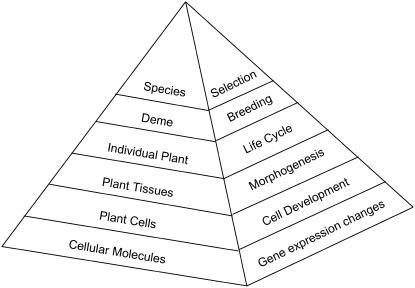
Biological Systems Arranged in a Hierarchy of Increasing Organizational Complexity. Each lower level through numerous and complex interactions of its constituents creates the level above as an emergent property. On the left is a static compositional hierarchy and on the right a dynamic developmental and evolutionary hierarchy incorporating time dependence of change.
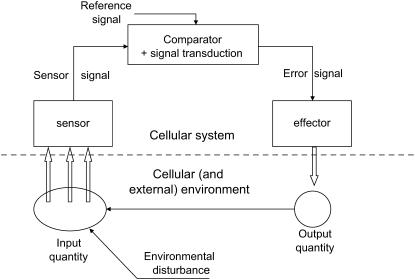
Basic Control Design of a System Manipulating Many Aspects of Plant Behavior and Incorporating Negative Feedback. The primary element involves an assessment of output by a feedback loop using a comparator that assesses current input against a predetermined reference signal. In a simple metabolic system or pathway, the end product uses the first enzyme in the sequence as the reference signal and controls metabolic flux through inhibition. In more complex cellular and tissue systems, the reference signal is currently unknown. Note that in growth and tissue development there are feedback loops operating continuously because growth in turn continually alters the external environment that feeds back into the system.
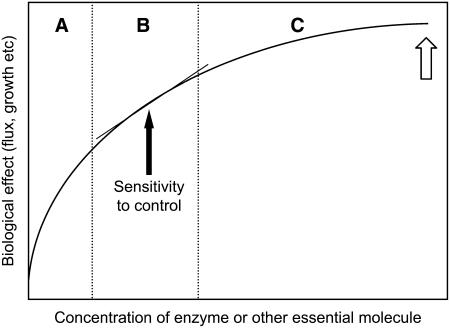
Typical Dose–Response Curve of the Concentration of Necessary Molecules against Response. The graph indicates the variation in response against concentration either of an enzyme or other essential molecule to the output of a metabolic pathway or a complex system process, such as growth or development. With increasing concentration, the curve results from increasing constraints by other linked molecules. Region A is typically occupied by systems in which mutation or inhibition has been used to lower the amount of the essential molecule. Region B is more typical of molecules whose amount influences the control characteristics of the system. Region C is typical of many essential molecules that have little direct influence on the control behavior of the system but by mutation or inhibition can be moved into region A. The sensitivity to control is the tangent to the curve and is indicated only for region B. The sensitivity is much higher or lower in regions A and C, respectively. The open arrow marks the typical position of an enzyme in a metabolic pathway.
References
-
- Andersen, P.B., Emmeche, C., Finnemann, N.O., and Christiansen, P.V. (2000). Downward Causation. (Aarhus, Denmark: Aarhus University Press).
-
- Aristotle (1946). The Politics (translated). E. Barker. (Oxford, UK: Oxford University Press).
-
- Ashby, W.R. (1956). Introduction to Cybernetics. (New York: John Wiley & Sons).
-
- Barabasi, A.L. (2002). Linked: The New Science of Networks. (Cambridge, MA: Perseus Publishing).
-
- Bateson, G. (1972). Steps to an Ecology of Mind. (New York: Ballantine).
Publication types
MeSH terms
LinkOut - more resources
Full Text Sources
