. 2006 Nov;4(11):e370.
doi: 10.1371/journal.pbio.0040370.

Rapid redistribution of synaptic PSD-95 in the neocortex in vivo

Affiliations

Rapid redistribution of synaptic PSD-95 in the neocortex in vivo

Noah W Gray et al. PLoS Biol. 2006 Nov.

Abstract

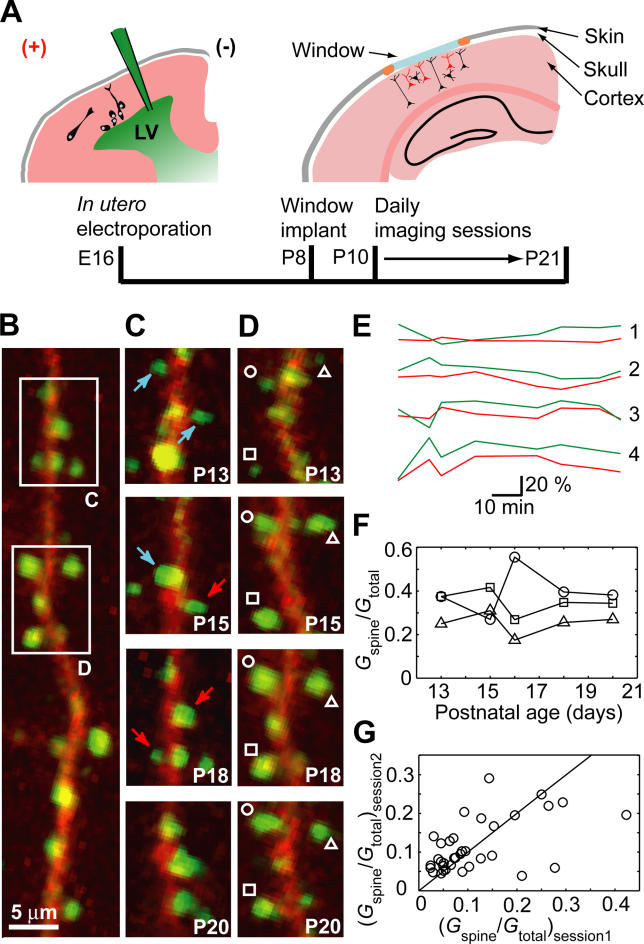
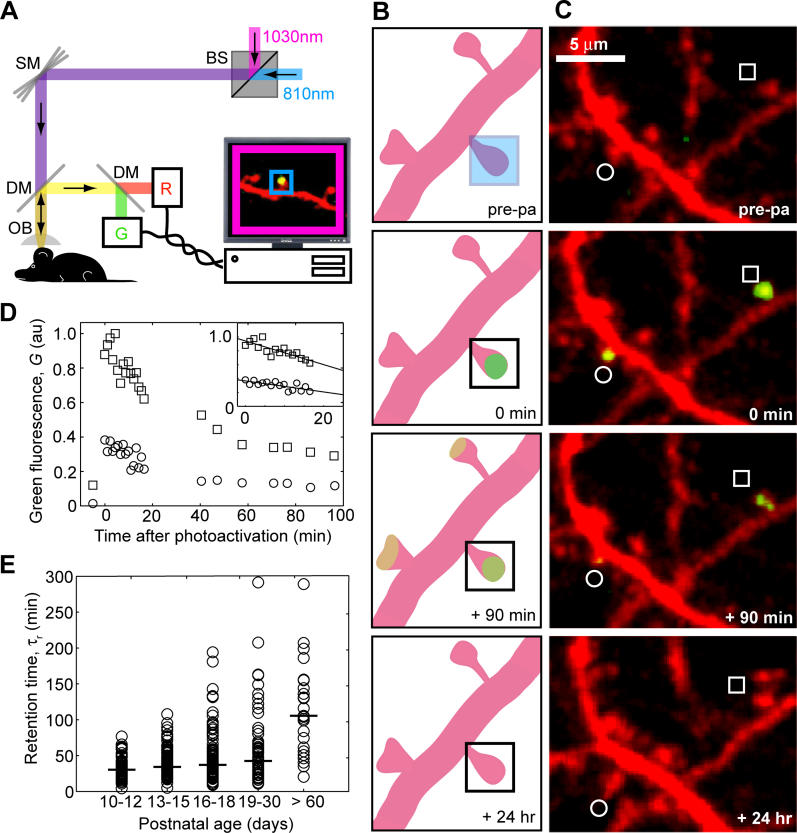
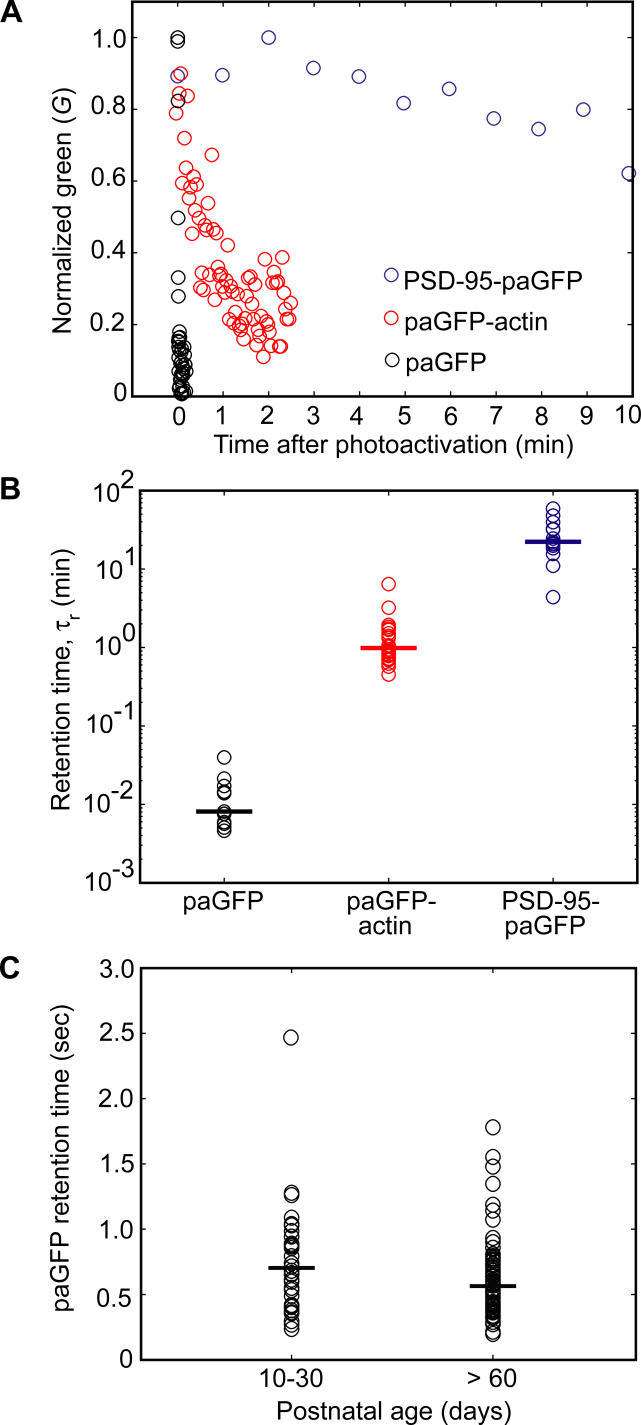
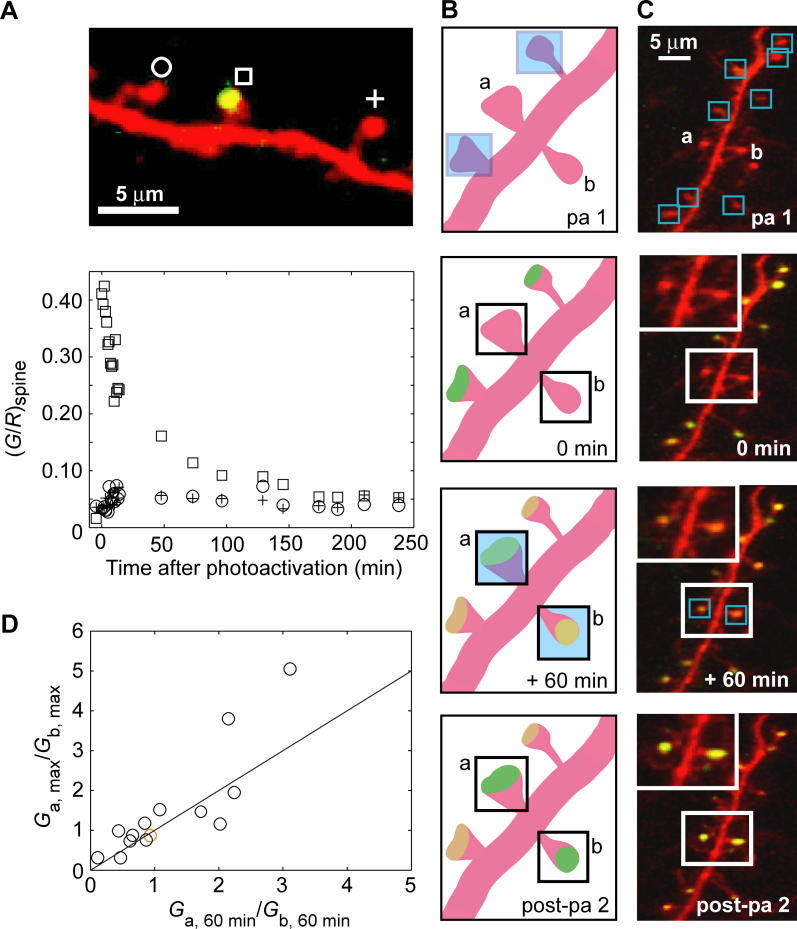
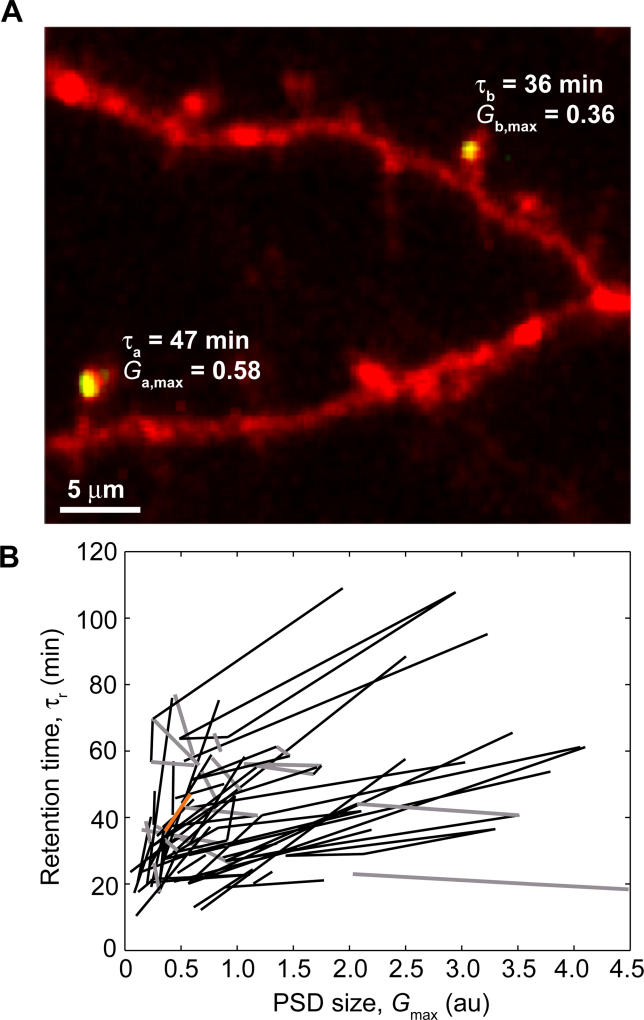
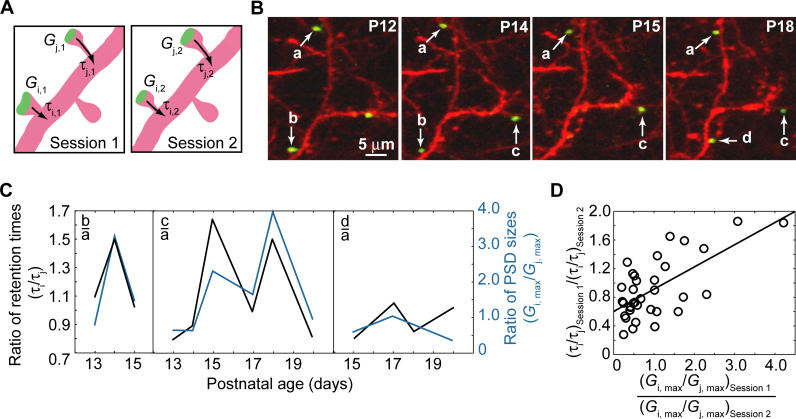
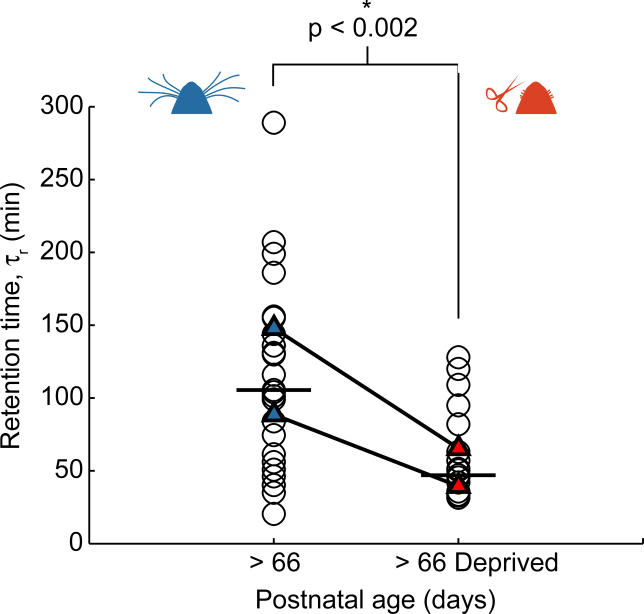
Most excitatory synapses terminate on dendritic spines. Spines vary in size, and their volumes are proportional to the area of the postsynaptic density (PSD) and synaptic strength. PSD-95 is an abundant multi-domain postsynaptic scaffolding protein that clusters glutamate receptors and organizes the associated signaling complexes. PSD-95 is thought to determine the size and strength of synapses. Although spines and their synapses can persist for months in vivo, PSD-95 and other PSD proteins have shorter half-lives in vitro, on the order of hours. To probe the mechanisms underlying synapse stability, we measured the dynamics of synaptic PSD-95 clusters in vivo. Using two-photon microscopy, we imaged PSD-95 tagged with GFP in layer 2/3 dendrites in the developing (postnatal day 10-21) barrel cortex. A subset of PSD-95 clusters was stable for days. Using two-photon photoactivation of PSD-95 tagged with photoactivatable GFP (paGFP), we measured the time over which PSD-95 molecules were retained in individual spines. Synaptic PSD-95 turned over rapidly (median retention times tau(r) is approximately 22-63 min from P10-P21) and exchanged with PSD-95 in neighboring spines by diffusion. PSDs therefore share a dynamic pool of PSD-95. Large PSDs in large spines captured more diffusing PSD-95 and also retained PSD-95 longer than small PSDs. Changes in the sizes of individual PSDs over days were associated with concomitant changes in PSD-95 retention times. Furthermore, retention times increased with developmental age (tau(r) is approximately 100 min at postnatal day 70) and decreased dramatically following sensory deprivation. Our data suggest that individual PSDs compete for PSD-95 and that the kinetic interactions between PSD molecules and PSDs are tuned to regulate PSD size.


Conflict of interest statement

Competing interests. The authors have declared that no competing interests exist.

Figures

Figure 1
Figure 1. A Subpopulation of PSD-95 Clusters Is Stable over Several Days
(A) Transfection of L2/3 pyramidal neurons by in utero electroporation. At E16, DNA was injected into the lateral ventricle (LV) and an electrical current was applied. At P8, imaging windows were implanted above the barrel field. High-resolution chronic imaging was performed from P10 to P21. (B) Dendritic segment transfected with PSD-95-GFP (green) and mCherry (red). (C) Time-lapse images showing turnover of PSD-95 clusters (box C, from [B]). Red arrows indicate gains; blue arrows indicate losses. (D) Time-lapse images showing stable PSD-95 clusters (box D, from [B]). (E) Fractional changes in PSD-95-GFP (green) and mCherry (red) fluorescence from four representative spines. Lines were offset for clarity. (F) Relative brightness of three PSDs (from [D]) over days. (Gtotal = fluorescence summed over all spines). (G) Brightness of individual PSDs is correlated across two imaging sessions 1 d apart (n = 3 animals, 51 spines).
Figure 2
Figure 2. Rapid Turnover of PSD-95 in Individual PSDs
(A) Schematic of the experimental setup. One laser (λ ~ 1,030 nm, magenta) was used to excite mCherry and photoactivated paGFP (paGFP*). A second laser (λ ~ 810 nm, blue) was used for photoactivation within a region of interest (blue box) within the field of view (magenta box). BS, beam-splitting cube; DM, dichroic mirror; OB, objective; R, G, photomultiplier tubes; SM, scan mirror. (B) Schematic of the experiment. Spines were selected for photoactivation (pre-pa, blue box), followed by time-lapse imaging. (C) Images collected before, and after (0 min, 90 min, and 24 h) photoactivation of two spines on different dendrites (age, P17). (D) Time course of PSD-95-paGFP* fluorescence (same as in [C]). The initial portion of the decay (inset) was used to extract the retention time (τ r) of PSD-95-paGFP*. (E) Retention times. Circles represent single spines and the horizontal bars indicate the medians (τ median). (P10–P12: τ median = 30 min, range 4–77 min, n = 6 animals, 74 spines; P13–P15: τ median = 34 min, range 5–108 min, n = 6 animals, 108 spines; P16–P18: τ median = 37 min, range 9–194 min, n = 8 animals, 95 spines; P19–P30: τ median = 43 min, range 11–291 min, n = 8 animals, 59 spines; >P60: τ median = 106 min, range 20–289 min, n = 4 animals, 25 spines).
Figure 3
Figure 3. The Magnitude of the PSD-95 Retention Time Is Determined by Its Interactions with the PSD
(A) Examples of the time course of paGFP* (black), paGFP*-actin (red), and PSD-95-paGFP* (blue) fluorescence after photoactivation in single spines (age, P10). (B) Retention times for paGFP*, paGFP*-actin, and PSD-95-paGFP* (age, P10) (circles indicate individual spines; bars indicate medians) (median τ paGFP = 0.47 s, range, 0.28–1.28 s, n = 2 animals, 11 spines; median τ paGFP-actin = 0.98 min, range, 0.45–6.42 min, n = 3 animals, 26 spines; median τ PSD-95-paGFP = 22 min, range, 4–59 min, n = 2 animals, 15 spines). (C) Escape time for paGFP* from individual spines (circles) as a function of age. (P10–P30: τ median = 0.72 s, range 0.28–2.38 s, n = 4 animals, 35 spines; > P60: τ median = 0.58 s, range 0.24–1.78 s, n = 1 animal, 105 spines).
Figure 4
Figure 4. Individual PSDs Share a Common Pool of PSD-95
(A) Photoactivation of PSD-95-paGFP in a single spine (square) is followed by an increase in green fluorescence in neighboring spines (circle and cross). Top, image. Bottom, corresponding fluorescence time course. Green fluorescence was normalized to red fluorescence in the spine. (B) Measuring the relationship between PSD-95 capture and PSD size. All but two (pa 1, a and b) “probe” spines were photoactivated. The fluorescence intensity within the probe spines was quantified (G a and G b) after 60 min. Subsequently the probe spines (a and b) were also photoactivated to estimate the sizes of their PSDs (post-pa 2, [G a, max and G b, max]). (C) Time-lapse images corresponding to (B). Insets show the probe spines a and b. Note, the last image was acquired after the probe spines were fully photoactivated. (D) Larger PSDs capture more PSD-95. Comparisons were performed for pairs of spines, a and b. The PSD size ratio (G a,max/G b,max) was proportional to the ratio of capture (G a,60min/G b,60min) (orange circle corresponds to the spine pair in [C]).
Figure 5
Figure 5. Larger Spines Retain PSD-95 Longer
(A) Image of two photoactivated spines, a and b, on two branches of the same dendrite. Ga ,max and Gb ,max are the fluorescence intensities of PSD-95-paGFP* immediately after photoactivation, a measure of PSD size. τ a , and τ b are the corresponding retention times. (B) Comparison of retention times and PSD sizes for pairs of spines. Each line corresponds to a pair of spines, a and b (black, positive slope, n = 64; gray, negative slope, n = 18, 6 animals; orange, example from [A]). Spines with larger PSDs have longer retention times.
Figure 6
Figure 6. PSD Size and PSD-95 Retention Time Vary Together from Day to Day
(A) Schematic of the experiment. Spines (i and j) on the same dendrite were photoactivated to measure PSD-95 fluorescence (G i,j) and the PSD-95 retention times (τ i,j). The ratios G i/G j and τ i/τ j were compared across imaging sessions. (B) Example of repeated imaging and photoactivation of three spines over 6 d. (C) Ratios of retention times (black) and ratios of PSD sizes (blue) for pairs of spines as a function of age (same experiment as [B]). (D) Changes in fluorescence retention time predict changes in PSD size between imaging sessions 1 d apart. The line is a least-squares fit to the data (n = 4 animals, 18 spine pairs, 35 2-d sequences).
Figure 7
Figure 7. PSD-95 Retention Time Is Modulated by Sensory Experience
Circles indicate individual spines (>P60 control data are repeated from Figure 2E). Horizontal bars indicate medians. Triangles indicate population averages for two animals in which retention times were measured before (blue) and after (red) whisker clipping.

Comment in

Similar articles

Cited by

References

    1. Beaulieu C, Colonnier M. A laminar analysis of the number of round-asymmetrical and flat-symmetrical synapses on spines, dendritic trunks, and cell bodies in area 17 of the cat. J Comp Neurol. 1985;231:180–189. - PubMed
    1. Nimchinsky EA, Sabatini BL, Svoboda K. Structure and function of dendritic spines. Annu Rev Physiol. 2002;64:313–353. - PubMed
    1. Wise SP, Fleshman JW, Jr, Jones EG. Maturation of pyramidal cell form in relation to developing afferent and efferent connections of rat somatic sensory cortex. Neuroscience. 1979;4:1275–1297. - PubMed
    1. Yuste R, Bonhoeffer T. Genesis of dendritic spines: insights from ultrastructural and imaging studies. Nat Rev Neurosci. 2004;5:24–34. - PubMed
    1. Micheva KD, Beaulieu C. Quantitative aspects of synaptogenesis in the rat barrel field cortex with special reference to GABA circuitry. J Comp Neurol. 1996;373:340–354. - PubMed

Publication types

Substances