. 2006 Nov;4(11):e374.
doi: 10.1371/journal.pbio.0040374.

Adaptation to ER stress is mediated by differential stabilities of pro-survival and pro-apoptotic mRNAs and proteins

Affiliations

Adaptation to ER stress is mediated by differential stabilities of pro-survival and pro-apoptotic mRNAs and proteins

D Thomas Rutkowski et al. PLoS Biol. 2006 Nov.

Abstract

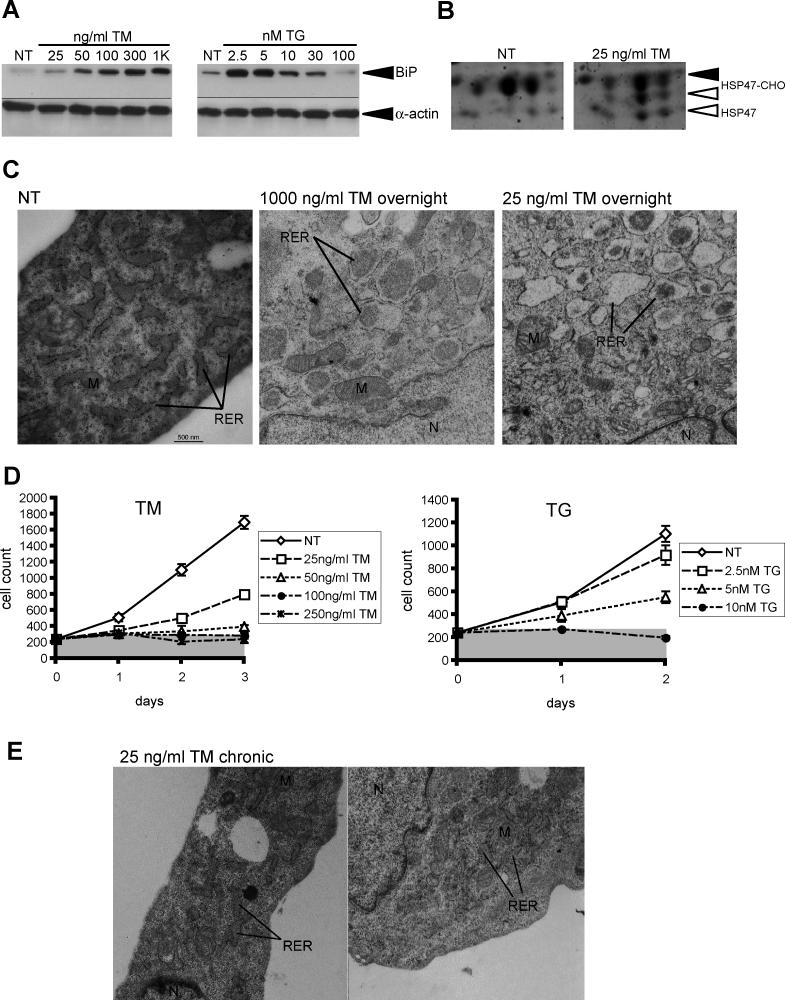
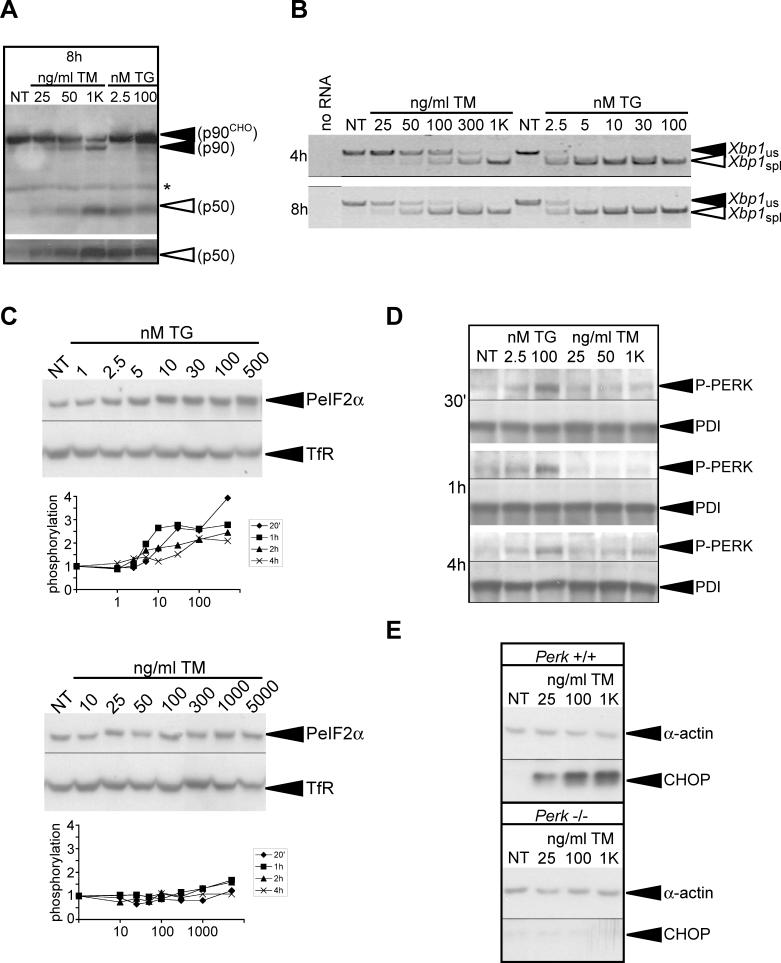
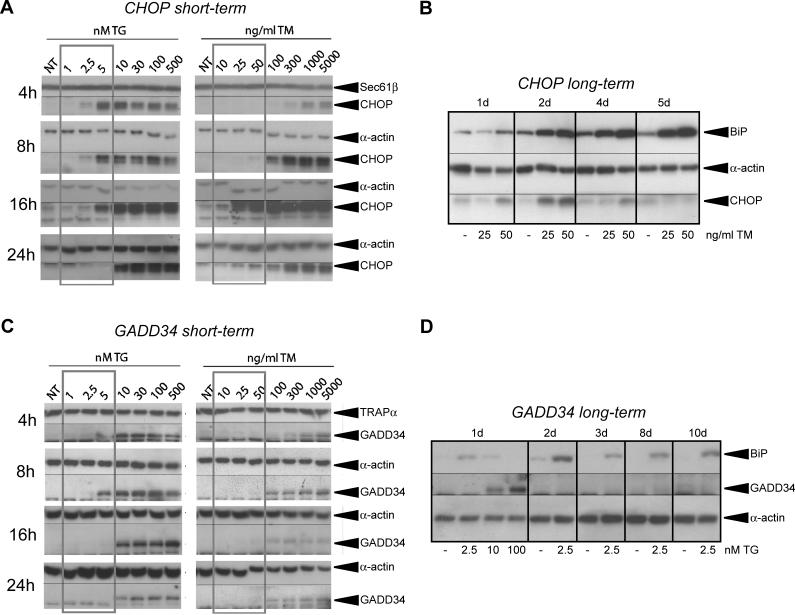
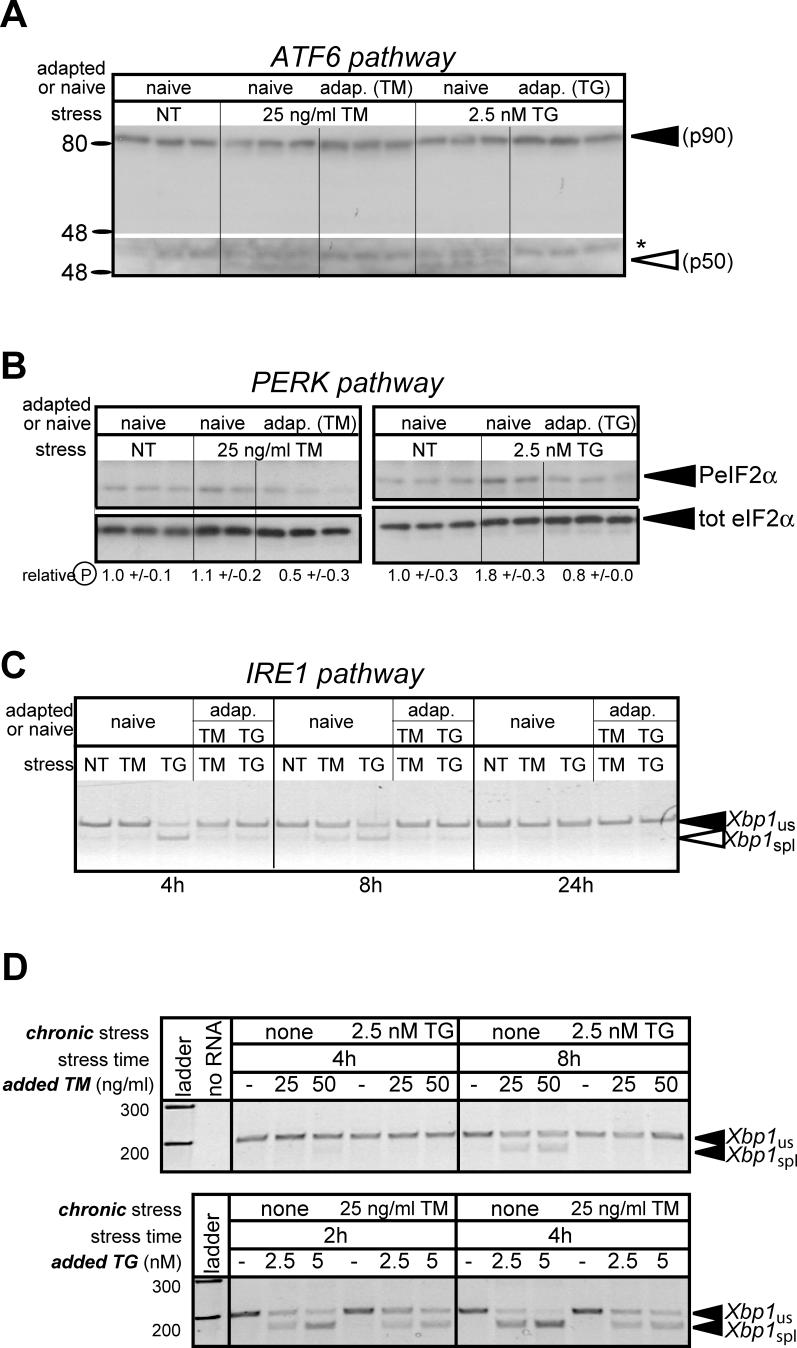
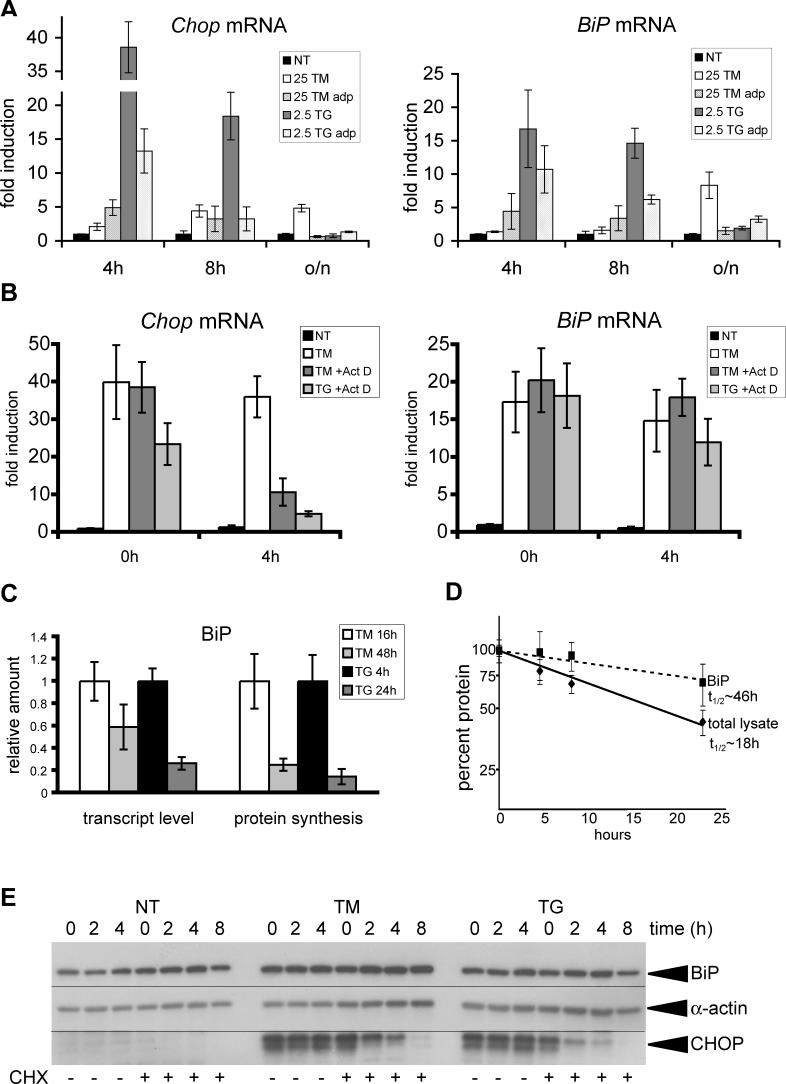
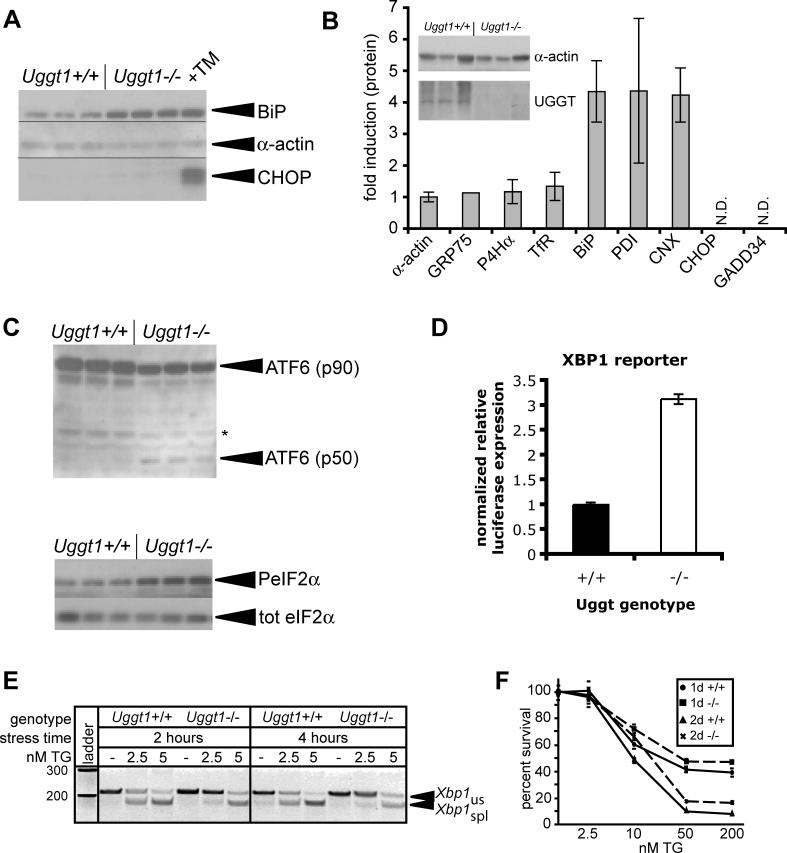
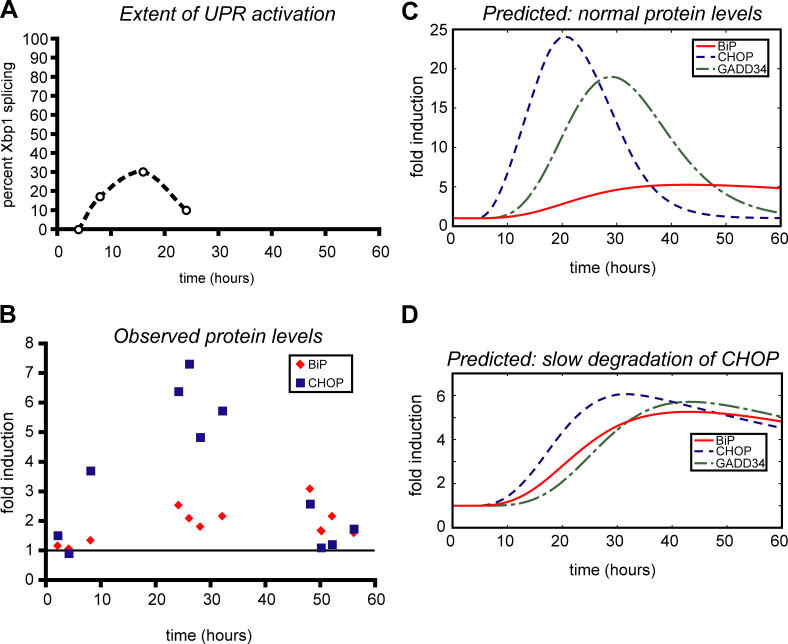
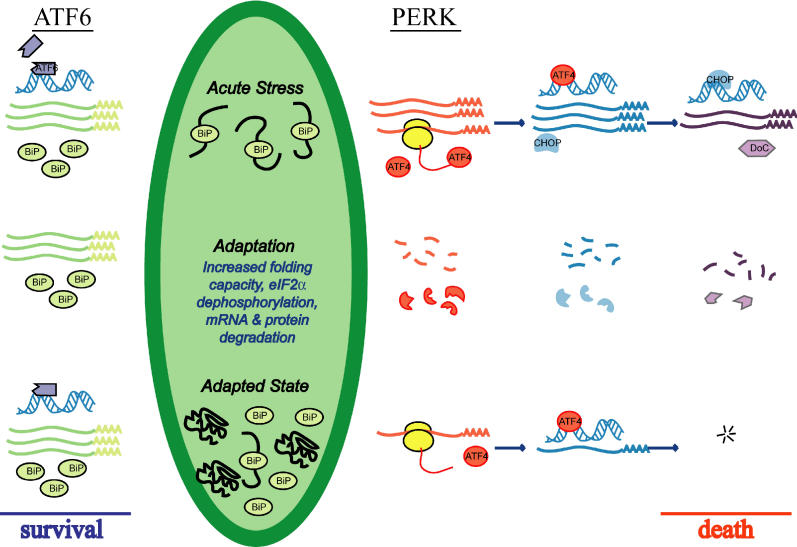
The accumulation of unfolded proteins in the endoplasmic reticulum (ER) activates a signaling cascade known as the unfolded protein response (UPR). Although activation of the UPR is well described, there is little sense of how the response, which initiates both apoptotic and adaptive pathways, can selectively allow for adaptation. Here we describe the reconstitution of an adaptive ER stress response in a cell culture system. Monitoring the activation and maintenance of representative UPR gene expression pathways that facilitate either adaptation or apoptosis, we demonstrate that mild ER stress activates all UPR sensors. However, survival is favored during mild stress as a consequence of the intrinsic instabilities of mRNAs and proteins that promote apoptosis compared to those that facilitate protein folding and adaptation. As a consequence, the expression of apoptotic proteins is short-lived as cells adapt to stress. We provide evidence that the selective persistence of ER chaperone expression is also applicable to at least one instance of genetic ER stress. This work provides new insight into how a stress response pathway can be structured to allow cells to avert death as they adapt. It underscores the contribution of posttranscriptional and posttranslational mechanisms in influencing this outcome.


Conflict of interest statement

Competing interests. The authors have declared that no competing interests exist.

Figures

Figure 1
Figure 1. UPR Activation Can Permit Cell Survival and Proliferation
(A) MEFs were cultured for 24 h in the presence of increasing concentrations of TM or TG. Cell lysates were then probed by immunoblot with antibodies specific for BiP, or α-actin as a loading control. (B) MEFs were cultured in the presence of 25-ng/ml TM or vehicle. The ER fraction was isolated from each by differential centrifugation, and was then separated by two-dimensional SDS-PAGE. The gels were stained for total protein with SYPRO Ruby. The series of spots corresponding to the ER-resident sentinel glycoprotein HSP47, identified by mass spectrometry, is indicated, with fully glycosylated (HSP47-CHO, filled arrow), underglycosylated (HSP47-CHO, open arrow) and unglycosylated (HSP47, open arrow) species visible. There are four isoforms of HSP47 that differ in isolectric point. Treatment of cells in a higher concentration of TM confirmed that the faster-migrating species are under- or non-glycosylated forms of the protein. (C) MEFs were treated overnight in the indicated concentration of TM. Cells were fixed in 2.5% glutaraldehyde, then prepared for transmission electron microscopic analysis. Nuclei (N), mitochondria (M), and rough ER (RER) are indicated. All images are at 25,000× magnification. Scale bar represents 500 nm. (D) MEFs were plated in replicate and exposed to varying concentrations of TM or TG, with the media and stressor refreshed daily. At each day, cells from individual plates were washed and trypsinized, and the cell concentration in the disrupted cell suspension was determined using an automated cell counter. Each suspension was counted twice, and error bars represent means ± SDM from triplicate plates. The numbers given on the y-axis represent cell number per milliliter in the diluted cell suspension. The gray bar is extended from the starting cell count plus the standard deviation, to allow net growth of the culture, or lack thereof, to be more readily assessed. (E) Cells were cultured for 6 d in the presence of 25-ng/ml TM, refreshed daily, and analyzed by electron microscopy for ER structure as in (C).
Figure 2
Figure 2. Mild ER Stress Activates ATF6, IRE1, and PERK
(A) Following treatment for 8 h in the indicated concentrations of TM or TG, MEFs were probed for expression of ATF6α. The uncleaved forms, both glycosylated (p90CHO) and unglycosylated (p90), are visible, as is the active (p50) form. The bottom panel is a darker exposure of just the active form of ATF6α. The asterisk denotes a nonspecific background band. (B) Total RNA was isolated from MEFs treated for 4 or 8 h with the indicated concentrations of TM or TG. RT-PCR with gene-specific primers was used to simultaneously detect both spliced (spl) and unspliced (us) Xbp1 mRNA. The image is presented in black-and-white inverted form for greater visual clarity. (C) After varying intervals of exposure to TG (top panel) or TM (bottom panel), lysates from MEFs were prepared and probed by immunoblot with antibodies specific for phosphorylated eIF2α or transferrin receptor (TfR) as a loading control. The blot from the 2-h time point is shown as representative. The extent of eIF2α phosphorylation relative to untreated control cells was quantitated by densitometry, and is shown in graphical form for each time point below the blots. (D) Cells were treated with the indicated concentrations of TG or TM for 30 min, 1 h, or 4 h, and protein lysates were harvested for immunoblot with antibodies specific for the phosphorylated form of PERK (P-PERK), or PDI as a loading control. Specificity of the phospho-PERK antibody was confirmed using lysates from Perk−/− cells (unpublished data). (E) Lysates from Perk−/− or wild-type matched MEFs were prepared after 24 h of exposure to TM as indicated. Levels of CHOP and α-actin were assessed by immunoblot. Images for Perk+/+ and Perk−/− cells were taken from the same exposure.
Figure 3
Figure 3. Expression of CHOP and GADD34 Correlates with Cell Fate
(A) MEFs were treated with increasing concentrations of TG or TM for the indicated times, followed by cell lysis and immunoblot for CHOP, or α-actin or Sec61β to judge loading. The concentrations outlined by the gray box are those that allow for survival. For every time-point, the TM and TG panels were taken from the same blot, and the same exposure time. (B) MEFs were treated for up to 5 d in the continuous presence of 25- or 50-ng/ml TM, with the media and stressor refreshed each day; and expression of CHOP, BiP, and α-actin was probed by immunoblot. (C) Same as in (A), probing instead for GADD34, or α-actin or TRAPα as loading controls. (D) Cells treated continuously in TG at the indicated concentrations were probed for expression of BiP, GADD34, and α-actin by immunoblot.
Figure 4
Figure 4. Adaptation Suppresses Further UPR Activation
(A) Cells were cultured in triplicate for two passages in the continuous presence of 25-ng/ml TM or 2.5 nM TG (“adapted” cells), or vehicle (“naive” cells). TM or TG was then added to naive cells at the indicated concentrations, or re-added to adapted cells likewise. After 8 h (when ATF6α activation is most robust; see Figure 2A; also unpublished data), cellular lysates were collected and probed for expression of the active form of ATF6α by immunoblot. The top portion of the figure shows a lighter exposure (on this gel, the unglycosylated form of full-length ATF6α [p90] shifts only slightly relative to the glycosylated form), and the bottom portion shows a darker exposure of just the cleaved form, and a non-specific background band (marked with an asterisk [*]). Vertical hairlines are used for visual clarity (also in [B] and [C]). (B) Cells were treated as in (A), but lysates were taken at 8 h (for TM treatment) or 2 h (for TG treatment) after the addition of stressor, and probed by immunoblot for expression of either phosphorylated eIF2α (top portion) or total eIF2α (bottom portion). Average extent of eIF2α phosphorylation, normalized against naïve untreated cells and shown ± SDM, is given below each panel. (C) Cells were treated as in (A), and total RNA was harvested 4, 8, or 24 h after stressor addition or readdition, for RT-PCR amplification of Xbp1 mRNA as in Figure 2B. (D) Cells adapted to chronic TG (top panel) or chronic TM (bottom panel), or cells passaged in parallel with vehicle alone (“none”), were treated with either TM (top panel) or TG (bottom panel) following adaptation in the opposite stressor. At the indicated intervals after exposure to the additional stressor, RNA was prepared and assessed for Xbp1 splicing by RT-PCR as in Figure 2B.
Figure 5
Figure 5. Pro-apoptotic mRNAs and Proteins Are Selectively Unstable
(A) Naive or adapted (adp) cells were treated, or retreated, with TM or TG. After 4, 8, or 24 h of stress (for naive cells) or media re-addition (for adapted cells), total RNA was isolated and the expression of BiP and Chop was quantitated by real-time RT-PCR, normalizing against 18S rRNA expression. Error bars represent means ± SDM from RNA isolated from three independent plates. (B) MEFs were treated with 25-ng/ml TM overnight or 2.5-nM TG for 4 h, and actinomycin D (Act D) was added as indicated to a final concentration of 5 μg/ml to prevent new mRNA synthesis. RNA was then harvested at 0 or 4-h time points (“time 0” followed 15 min of actinomycin treatment to allow for full effect), and expression of Chop and BiP mRNAs was measured by real-time RT-PCR as in (A). Error bars represent means ± SDM from replicate PCR reactions of a single experiment. (C) MEFs were grown for 48 h in media containing 10% of the normal amount of methionine and cysteine, and were treated either for the full 48 h or just the last 16 h with 25-ng/ml TG (or alternatively, cells were treated for 24 or 4 h with 2.5 nM TG). After treatment, three plates were immediately processed to harvest mRNA, and to the remaining three plates, 35S methionine/cysteine was added to a final concentration of 200 μCi/ml for 30 min, followed by cell lysis. Expression of BiP mRNA was assessed by real-time RT-PCR (“transcript level”), whereas the synthesis rate of BiP was measured by immunoprecipitation with an antibody recognizing the KDEL ER retention motif. SDS-PAGE and autoradiography revealed BiP expression, which was then normalized against TCA-precipitable counts from the immunoprecipitate supernatants, as a measure of total radioactivity input. Error bars are SDMs derived from independent readings of mRNA and protein synthesis from three plates each. (D) Untreated cells were subjected to steady-state labeling overnight with 35S Met/Cys. Cells were then chased in non-radioactive media containing excess methionine and cysteine, and either vehicle alone or 25-ng/ml TM for 0, 4, 8, or 24 h. The amount of radioactivity in the lysates was determined by TCA precipitation of aliquots, and was normalized against total protein concentration, whereas the amount of labeled BiP was assessed by immunoprecipitation. At each time point, three independent plates were harvested. The presence or absence of TM during the chase period did not significantly affect the measured half-life of either BiP or the lysate as a whole; therefore, each point represents input from replicate plates in both conditions. (E) MEFs were pretreated either for 4 h with 2.5 nM TG or overnight with 25 ng/ml TM to induce expression of CHOP. Cycloheximide (CHX) was then added as indicated at a final concentration of 50 μg/ml to block protein synthesis. Protein lysates were harvested 0, 2, 4, or 8 h after CHX addition and the expression of BiP, CHOP, and α-actin was probed by immunoblot.
Figure 6
Figure 6. Uggt1 Deficiency Recapitulates an Adapted Phenotype
(A) Lysates were prepared from three independent plates of either Uggt1−/− MEFs or wild-type counterparts, or from one plate of wild-type MEFs treated with 1-μg/ml TM overnight. BiP, α-actin, and CHOP expression were probed by immunoblot as in Figure 3B. (B) Lysates were prepared from either Uggt1−/− MEFs or wild-type counterparts. Immunoblot for α-actin and UGGT1 (inset) from three separate plates confirmed their identities. The lysates were then probed by immunoblot for expression of α-actin, the mitochondrial chaperone GRP75, the collagen-specific ER chaperone prolyl-4-hydroxylase-α (P4Hα), the membrane-localized transferrin receptor (TfR), BiP, PDI, calnexin (CNX), CHOP, or GADD34. Expression was normalized against α-actin. Error bars represent means ± SDM from at least three measurements, except for Grp75 for which data could only be reliably quantitated from one measurement because of high background. CHOP and GADD34 were not quantitatively detected in either lysate. (C) Lysates prepared as in (A) were analyzed for production of the cleaved form of ATF6α (top panel) or the phosphorylated form of eIF2α (bottom panel) by immunoblot. The band marked as p50 comigrates with a band induced by high TM treatment in wild-type cells (unpublished data). (D) Wild-type and Uggt1−/− MEFs were cotransfected with an XBP1-dependent luciferase reporter and a constitutive β-galactosidase reporter. Lysates were analyzed for luciferase expression 24 h after transfection, normalized against β-galactosidase expression. Error bars represent means ± SDM from three independent plates. (E) Wild-type and Uggt1−/− MEFs were treated with 2.5 or 5 nM TG for 2 or 4 h, and Xbp1 splicing was assessed as in Figure 2B. (F) Wild-type (solid lines) and Uggt1−/− (dashed lines) MEFs were plated on 96-well plates and treated with increasing concentrations of TG, for either 1 or 2 d. Cell proliferation was estimated by an MTT assay, with each genotype normalized against untreated cells of that genotype. The MTT assay measures mitochondrial reduction of a tetrazolium dye, and is a measure of cell viability and proliferation.
Figure 7
Figure 7. Rapid Degradation of CHOP and GADD34 mRNAs and Proteins Allows Their Expression to Be Down-Regulated as Cells Adapt
(A) Xbp1 mRNA splicing during a 24-h time course of TM treatment (25 ng/ml) was quantitated and used to approximate the stress level in cells at given times (taken from Figure 2B and unpublished data). These data were used as the basis for the stress input in a mathematical model describing the production of BiP, CHOP, and GADD34 mRNAs and proteins. The dashed line is used only to provide a visual aid for the trend of splicing over the time course. (B) The relative expression of CHOP and BiP protein was quantitated by immunoblot from cells exposed to 25-ng/ml TM over a 48-h time course (the media and stressor were refreshed at 24 h), normalized against untreated cells (data taken from an experiment, not shown, similar to Figure 3A and 3C). (C) and (D) A mathematical model used experimental data (such as that obtained from Figures 3 and 5) to derive production and degradation rates for ATF4, CHOP, and GADD34, and ATF6 and BiP, and was used to test the effect of altering the stabilities of components within the ATF4-CHOP-GADD34 axis on the responsiveness of these components to the stress level. “C” shows the model-predicted expression of these proteins using their experimentally derived degradation rates, while “D” illustrates the changes in CHOP and GADD34 protein levels brought about by making the degradation rate of CHOP protein comparable to that of BiP protein. Note the change in y-axis scale between panels “C” and “D”; expression of BiP does not change between these panels. See text and Protocol S1 for further details.
Figure 8
Figure 8. Model for Generation of an Adaptive Response to Chronic Stress
The initial exposure of cells to ER stress leads to activation of all three proximal sensors of stress (only the ATF6 and PERK pathways are shown here) and up-regulation of UPR target genes. However, prolonged exposure to mild stress allows for adaptation, when selective degradation of mRNA and protein attenuates expression of CHOP and its downstream targets (DoCs), but not of ER chaperones like BiP. Increased BiP levels in the ER facilitate adaptation, both by assisting protein folding, and probably by binding to, and thereby inhibiting activation of, the proximal sensors. An adapted state might be characterized by low-level activation of the sensors, that is sufficient to maintain elevated BiP protein levels, but not of CHOP or GADD34. See text for further details.

Comment in

References

    1. Stirling PC, Lundin VF, Leroux MR. Getting a grip on non-native proteins. EMBO Rep. 2003;4:565–570. - PMC - PubMed
    1. Kaufman RJ. Orchestrating the unfolded protein response in health and disease. J Clin Invest. 2002;110:1389–1398. - PMC - PubMed
    1. Rutkowski DT, Kaufman RJ. A trip to the ER: Coping with stress. Trends Cell Biol. 2004;14:20–28. - PubMed
    1. Bertolotti A, Zhang Y, Hendershot LM, Harding HP, Ron D. Dynamic interaction of BiP and ER stress transducers in the unfolded-protein response. Nat Cell Biol. 2000;2:326–332. - PubMed
    1. Liu CY, Schroder M, Kaufman RJ. Ligand-independent dimerization activates the stress response kinases IRE1 and PERK in the lumen of the endoplasmic reticulum. J Biol Chem. 2000;275:24881–24885. - PubMed

Publication types

MeSH terms