. 2006 Nov 14;103(46):17402-7.
doi: 10.1073/pnas.0608396103. Epub 2006 Nov 7.

Analysis of oncogenic signaling networks in glioblastoma identifies ASPM as a molecular target

Affiliations

Analysis of oncogenic signaling networks in glioblastoma identifies ASPM as a molecular target

S Horvath et al. Proc Natl Acad Sci U S A. .

Abstract

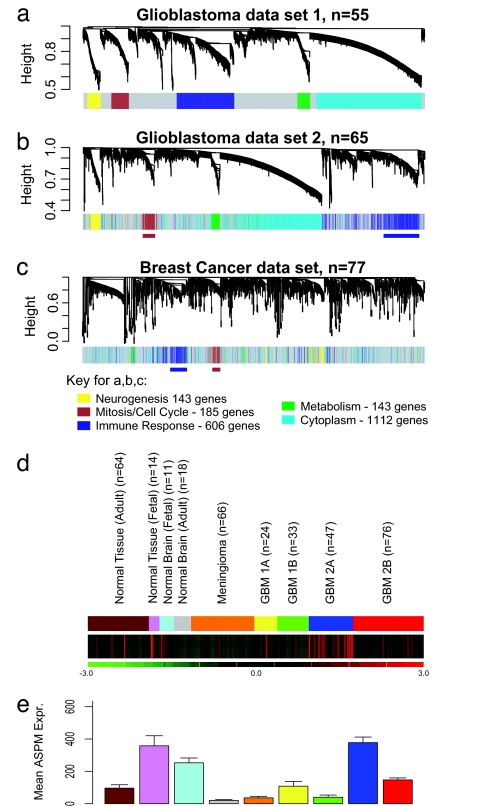
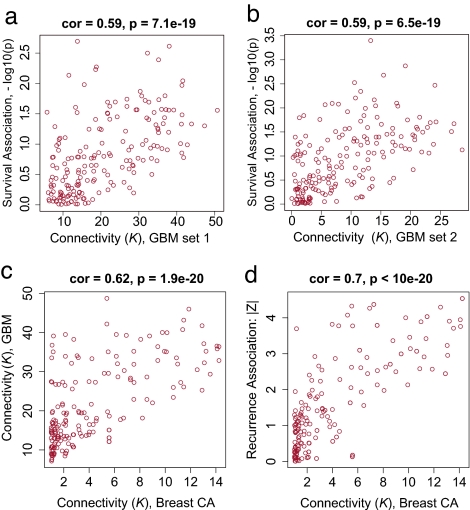
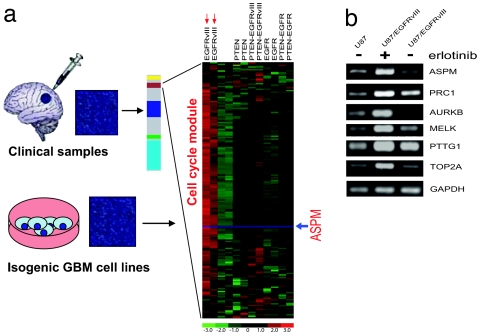
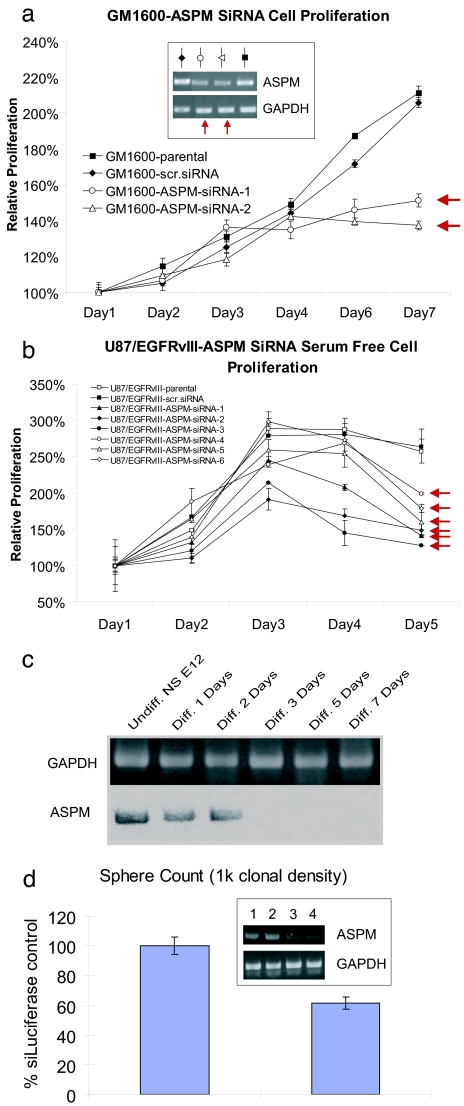
Glioblastoma is the most common primary malignant brain tumor of adults and one of the most lethal of all cancers. Patients with this disease have a median survival of 15 months from the time of diagnosis despite surgery, radiation, and chemotherapy. New treatment approaches are needed. Recent works suggest that glioblastoma patients may benefit from molecularly targeted therapies. Here, we address the compelling need for identification of new molecular targets. Leveraging global gene expression data from two independent sets of clinical tumor samples (n = 55 and n = 65), we identify a gene coexpression module in glioblastoma that is also present in breast cancer and significantly overlaps with the "metasignature" for undifferentiated cancer. Studies in an isogenic model system demonstrate that this module is downstream of the mutant epidermal growth factor receptor, EGFRvIII, and that it can be inhibited by the epidermal growth factor receptor tyrosine kinase inhibitor Erlotinib. We identify ASPM (abnormal spindle-like microcephaly associated) as a key gene within this module and demonstrate its overexpression in glioblastoma relative to normal brain (or body tissues). Finally, we show that ASPM inhibition by siRNA-mediated knockdown inhibits tumor cell proliferation and neural stem cell proliferation, supporting ASPM as a potential molecular target in glioblastoma. Our weighted gene coexpression network analysis provides a blueprint for leveraging genomic data to identify key control networks and molecular targets for glioblastoma, and the principle eluted from our work can be applied to other cancers.


Conflict of interest statement

The authors declare no conflict of interest.

Figures

Fig. 1.
Fig. 1.
Detection of gene coexpression modules in glioblastoma and breast cancer. (a) In glioblastoma data set 1, five gene coexpression modules were detected. (b) The network genes derived from data set 1 were mapped to data set 2. The genes maintain the same color coding for module association from data set 1, facilitating visual inspection of module conservation. The same module association in both data sets was found for 87.4% of genes (P = 2.2 × 10⁻¹⁶). (c) Two of the five glioblastoma modules (brown, cell cycle mitosis; blue, immune response) were detected in a set of 77 breast cancer samples. (d) The green/red expression diagram shows the relative expression of the module across 353 samples, including 180 glioblastomas, 66 meningiomas, 64 normal adult body tissues of different types, 18 adult normal brain tissue samples, 11 fetal brain tissue samples, and 14 fetal nonbrain tissue samples. The MCM is highly expressed in only a subset of glioblastomas (type 2A) (12), and its expression pattern is similar to a fetal proliferation signature. (e) Mean expression of ASPM in the 353 clinical samples, including glioblastomas, meningiomas, normal brain, normal body tissues, fetal brain, and fetal body tissues.
Fig. 2.
Fig. 2.
Clinical association between hub gene status and outcome in glioblastoma and breast cancer. (a) Scatterplot between connectivity K in the MCM (x axis) and gene significance defined as GS = –log10(Cox P value) (y axis) for glioblastoma data set 1. (b) Analogous scatterplot for glioblastoma data set 2. (c) Scatterplot between intramodular connectivity K in the breast cancer network (x axis) and K in the glioblastoma network (y axis). (d) Scatterplot between intramodular connectivity K and prognostic gene significance in breast cancer (14).
Fig. 3.
Fig. 3.
Modeling of the MCM in isogenic glioblastoma cells with varying levels of EGFRvIII, EGFR, and PTEN expression, and effect of EGFRvIII inhibition on the MCM module. (a) Gene expression profiling was performed in two independent samples for each cell line from RNA extracted from serum starved isogenic U87 glioblastoma cells (unlabeled) or U87 cells expressing the EGFRvIII oncogene, WT EGFR, and the PTEN tumor suppressor protein alone or in combination as labeled. Biochemical analyses of these cell lines has been performed in ref. . The expression pattern of the cell cycle/mitosis module genes demonstrated that this module is downstream of EGFRvIII, and is inhibited by coexpression of PTEN. ASPM (red arrow) is identified as one of the hub genes within this module. (b) Erlotinib treatment inhibits expression a representative subset of cell cycle/mitisos/undifferentiated cancer MS genes U87vIII overexpressing/PTEN deficient glioblastoma cells.
Fig. 4.
Fig. 4.
Inhibition of ASPM by RNAi inhibits glioblastoma cell growth and neural stem cell self renewal. (a) Expression of two different ASPM siRNAs dramatically inhibits the proliferation of low-passage primary patient-derived glioblastoma cell line. (b) Stable infection with ASPM siRNA inhibits the growth of five independent stable clones of U87-EGFRvIII-ASPM siRNA expressing cells. This is mediated by a GI arrest (data not shown). (c) Differentiation of mouse embryonic neurospheres by basic fibroblast growth factor or EGF diminishes ASPM expression. (d) siRNA-mediated knockdown of ASPM in mouse embryonic neurospheres inhibits neurosphere formation. The inset shows ASPM expression after treatment with control (lane 1), 25 (lane 2), 50 (lane 3), or 100 nM (lane 4) ASPM. The graph shows numbers of secondary neurospheres generated from progenitors treated with 100 nM siRNA.

References

    1. Sawyers C. Nature. 2004;432:294–297. - PubMed
    1. Mellinghoff IK, Wang MY, Vivanco I, Haas-Kogan DA, Zhu S, Dia EQ, Lu KV, Yoshimoto K, Huang JH, Chute DJ, et al. N Engl J Med. 2005;353:2012–2024. - PubMed
    1. Liu ET, Karuturi KR. N Engl J Med. 2004;350:1595–1597. - PubMed
    1. Ebert BL, Golub TR. Blood. 2004;104:923–932. - PubMed
    1. Hood L, Heath JR, Phelps ME, Lin B. Science. 2004;306:640–643. - PubMed

Publication types