. 2007 Jan;45(1):47-53.
doi: 10.1128/JCM.01233-06. Epub 2006 Nov 8.

Strain-specific single-nucleotide polymorphism assays for the Bacillus anthracis Ames strain

Affiliations

Strain-specific single-nucleotide polymorphism assays for the Bacillus anthracis Ames strain

Matthew N Van Ert et al. J Clin Microbiol. 2007 Jan.

Abstract

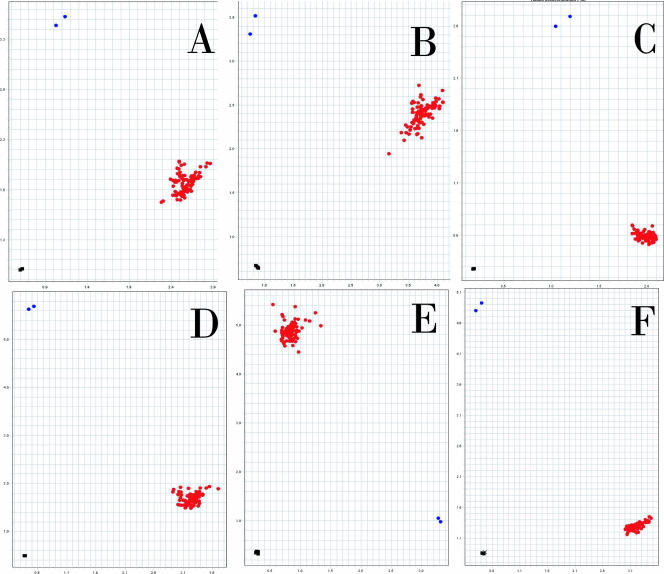
Highly precise diagnostics and forensic assays can be developed through a combination of evolutionary analysis and the exhaustive examination of genomic sequences. In Bacillus anthracis, whole-genome sequencing efforts revealed ca. 3,500 single-nucleotide polymorphisms (SNPs) among eight different strains and evolutionary analysis provides the identification of canonical SNPs. We have previously shown that SNPs are highly evolutionarily stable, and the clonal nature of B. anthracis makes them ideal signatures for subtyping this pathogen. Here we identified SNPs that define the lineage of B. anthracis that contains the Ames strain, the strain used in the 2001 bioterrorist attacks in the United States. Sequencing and real-time PCR were used to validate these SNPs across B. anthracis strains, including (i) 88 globally and genetically diverse isolates; (ii) isolates that were shown to be genetic relatives of the Ames strain by multiple-locus variable number tandem repeat analysis (MLVA); and (iii) several different lab stocks of the Ames strain, including a clinical isolate from the 2001 letter attack. Six SNPs were found to be highly specific for the Ames strain; four on the chromosome, one on the pX01 plasmid, and one on the pX02 plasmid. All six SNPs differentiated the B. anthracis Ames strain from the 88 unique B. anthracis strains, while five of the six separated Ames from its close genetic relatives. The use of these SNPs coupled with real-time PCR allows specific and sensitive (<100 fg of template DNA) identification of the Ames strain. This evolutionary and genomics-based approach provides an effective means for the discovery of strain-specific SNPs in B. anthracis.


Figures

FIG. 1.
FIG. 1.
TaqMan endpoint allelic discrimination plots of the six Ames-specific SNP assays. Chromosomal SNPs for Branch1-7, Branch1-26, Branch1-28, and Branch1-31 loci are shown in panels A, B, C, and D, respectively. The dots along the y axis (n = 2; blue) demonstrate the Ames-specific genotype; samples along the x axis (red) demonstrate genotyping of the non-Ames B. anthracis samples (diverse 88). Samples near the plot origin are negative, no-template controls (n = 3). Panel E illustrates the PS-1 pX01 plasmid marker. The dots along the x axis (blue; n = 2) demonstrate the Ames-specific genotype; samples along the y axis (red) demonstrate genotyping of the non-Ames B. anthracis samples (diverse 88). Samples near the plot origin are no-template controls (n = 2) or pX01-negative B. anthracis strains (n = 2). Panel F illustrates the pXO2 plasmid marker PS-52. The dots along the y axis (blue) demonstrate the Ames-specific genotype; samples along the x axis (red) demonstrate genotyping of the “non-Ames” B. anthracis samples (diverse 88). Samples near the plot origin are negative controls (n = 2) or pX02-negative B. anthracis strains (n = 1). All PCRs were cycled 40 times.
FIG. 2.
FIG. 2.
(A) Real-time plots of the Branch1-7 TaqMan MGB allelic-discrimination assay showing a dilution curve of Ames (A0462) DNA ranging from 100 pg to 10 fg (all quantities shown in triplicate; only fluorescence from the Ames allele probe is illustrated). (B) Endpoint allelic discrimination plots from the same Ames DNA dilution curve (blue cluster along the x axis) and from an equivalent non-Ames (A0488; Vollum) dilution curve (red cluster along the x axis) illustrate clear genotypic separation. Samples near the plot origin are negative controls (black squares; n = 6). Note that the samples containing higher amounts of DNA (100 pg) clustered further from the origin, and samples with low DNA levels (10 fg) clustered nearer the origin. Note that all replicates at 100 and 10 fg amplified for both strains. The PCR was cycled 50 times.

Similar articles

Cited by

References

    1. Easterday, W. R., M. N. Van Ert, T. S. Simonson, D. M. Wagner, L. J. Kenefic, C. J. Allender, and P. Keim. 2005. Use of single nucleotide polymorphisms in the plcR gene for specific identification of Bacillus anthracis. J. Clin. Microbiol. 43:1995-1997. - PMC - PubMed
    1. Easterday, W. R., M. N. Van Ert, S. Zanecki, and P. Keim. 2005. Specific detection of Bacillus anthracis using a TaqMan mismatch amplification mutation assay. BioTechniques 38:731-735. - PubMed
    1. Hoffmaster, A. R., C. C. Fitzgerald, E. Ribot, L. W. Mayer, and T. Popovic. 2002. Molecular subtyping of Bacillus anthracis and the 2001 bioterrorism-associated anthrax outbreak, United States. Emerg. Infect. Dis. 8:1111-1116. - PMC - PubMed
    1. Hurtle, W., E. Bode, D. A. Kulesh, R. S. Kaplan, J. Garrison, D. Bridge, M. House, M. S. Frye, B. Loveless, and D. Norwood. 2004. Detection of the Bacillus anthracis gyrA gene by using a minor groove binder probe. J. Clin. Microbiol. 42:179-185. - PMC - PubMed
    1. Keim, P., A. Kalif, J. Schupp, K. Hill, S. E. Travis, K. Richmond, D. M. Adair, and M. Hugh-Jones. 1997. Molecular evolution and diversity in Bacillus anthracis as detected by amplified fragment length polymorphism markers. J. Bacteriol. 179:818-824. - PMC - PubMed

Publication types