. 2006 Nov 21;103(47):17961-6.
doi: 10.1073/pnas.0608755103. Epub 2006 Nov 8.

The spine neck filters membrane potentials

Affiliations

The spine neck filters membrane potentials

Roberto Araya et al. Proc Natl Acad Sci U S A. .

Abstract

Dendritic spines receive most synaptic inputs in the forebrain. Their morphology, with a spine head isolated from the dendrite by a slender neck, indicates a potential role in isolating inputs. Indeed, biochemical compartmentalization occurs at spine heads because of the diffusional bottleneck created by the spine neck. Here we investigate whether the spine neck also isolates inputs electrically. Using two-photon uncaging of glutamate on spine heads from mouse layer-5 neocortical pyramidal cells, we find that the amplitude of uncaging potentials at the soma is inversely proportional to neck length. This effect is strong and independent of the position of the spine in the dendritic tree and size of the spine head. Moreover, spines with long necks are electrically silent at the soma, although their heads are activated by the uncaging event, as determined with calcium imaging. Finally, second harmonic measurements of membrane potential reveal an attenuation of somatic voltages into the spine head, an attenuation directly proportional to neck length. We conclude that the spine neck plays an electrical role in the transmission of membrane potentials, isolating synapses electrically.


Conflict of interest statement

The authors declare no conflict of interest.

Figures

Fig. 1.
Fig. 1.
Spine glutamate uncaging and morphological reconstructions. (A) Layer-5 pyramidal cell filled with Alexa Fluor 488. (Scale bar: 20 μm.) (Inset) Representative basal dendrite selected for uncaging. (Scale bar: 3 μm.) (B) Spatial resolution of uncaging. Red dots indicate the site of uncaging when laser beam was parked at different distances away from the head of the spine (≈0.2–2 μm). (Scale bar: 1 μm.) Graph shows effect of distance on uncaging potentials. Peak amplitude drops to zero if laser is 1.5 μm away from the spine head. Inset shows the average of 10 uncaging EPSPs at position 0.2 μm (red trace, position 1) and 0.8 μm (black trace, position 2) away from the spine head. (C) Comparison of spontaneous EPSPs and EPSPs after two-photon uncaging of glutamate (uncaging potentials). Dashed line indicates onset of glutamate uncaging or spontaneous events. (D) Neck length was measured from the base of the spine head toward the edge of the dendrite (orthogonal red line), and the head diameter was estimated by measuring the longest possible axis at any of the z-stacks of images as shown in E. (Scale bar: 1 μm.)
Fig. 2.
Fig. 2.
Effect of spine neck length on spine potentials. (A) Examples of uncaging potentials in spines with short and long necks. Red dots indicate the site of uncaging and traces corresponded to averages of ≈10 uncaging potentials for each spine. (B) Three neighboring spines (1, 2, and 3) with different neck lengths. Note the large difference in their uncaging potentials at the soma. (C) Plot of the uncaging potentials (peak amplitude) vs. neck length. Line is linear regression of the data, with a weighted fit including the standard error of each data point.
Fig. 3.
Fig. 3.
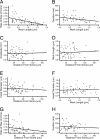
Correlations between morphological variables and uncaging potentials. (A and B) Correlation between the 10/90 rate of rise (A) and duration (B) of the uncaging potentials and neck length. (C–F) Correlations between peak amplitude (C), neck lengths (D), spine head diameter (E and F), 10/90 rate of rise (G), and duration of uncaging potentials (H) with distance of the spines from soma and between the spine head diameter and the spine neck length (F). Lines are linear fit (for values, see Results).
Fig. 4.
Fig. 4.
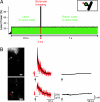
Long spines are activated by glutamate uncaging. (A) Protocol for the measurement of the intracellular free calcium at the head of the spine. (B) Two examples of long neck spines from a layer-5 pyramidal cell filled with Calcium Green-1. Red trace corresponded to the average measurements of the intracellular free calcium in the head of the spine indicated in response to the uncaging pulse. Black traces correspond to the average uncaging potential of the corresponding spine. Red dots indicate the site of uncaging. (Scale bar: 1 μm.)
Fig. 5.
Fig. 5.
Somatic voltage pulses are attenuated by the spine neck. (A) SHG image of a representative layer-5 pyramidal neuron, filled with FM 4-64, used for SHG spines voltage measurements. (B) High-resolution SHG image of dendritic spines on the basal dendrite. (C) Plot of normalized SHG response (SHG spine divided by SHG from adjacent dendritic shaft) vs. spine neck length. Line is the linear fit of the data, forcing the fit to cross the (0, 1) point. A similar fit was obtained without this requirement. For values, see Results. (Scale bars: A, 20 μm; B, 1 μm.)

References

    1. Shepherd G. J Neurophysiol. 1996;75:2197–2210. - PubMed
    1. Harris KM, Kater SB. Annu Rev Neurosci. 1994;17:341–371. - PubMed
    1. Yuste R, Denk W. Nature. 1995;375:682–684. - PubMed
    1. Denk W, Sugimori M, Llinás R. Proc Natl Acad Sci USA. 1995;92:8279–8282. - PMC - PubMed
    1. Goldberg J, Tamas G, Aronov D, Yuste R. Neuron. 2003;40:807–821. - PubMed

Publication types

LinkOut - more resources