. 2007 Jan;18(1):189-200.
doi: 10.1091/mbc.e06-05-0471. Epub 2006 Nov 8.

Depletion of E-cadherin disrupts establishment but not maintenance of cell junctions in Madin-Darby canine kidney epithelial cells

Affiliations

Depletion of E-cadherin disrupts establishment but not maintenance of cell junctions in Madin-Darby canine kidney epithelial cells

Christopher T Capaldo et al. Mol Biol Cell. 2007 Jan.

Abstract

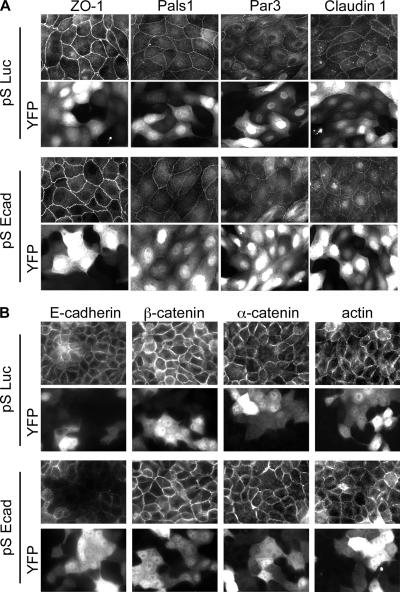
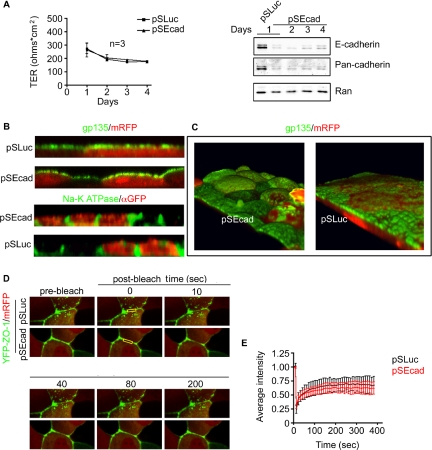
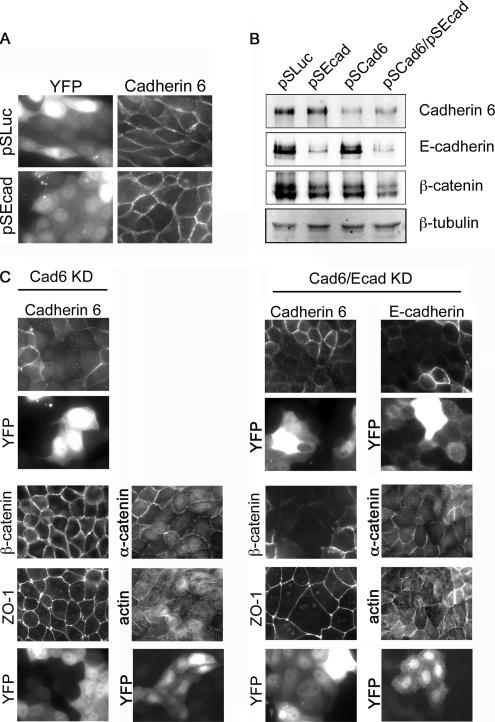
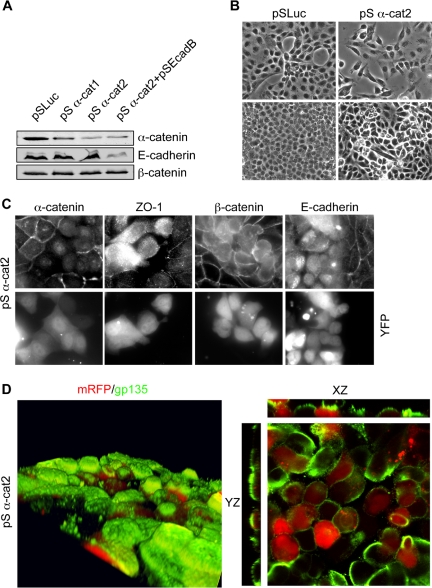
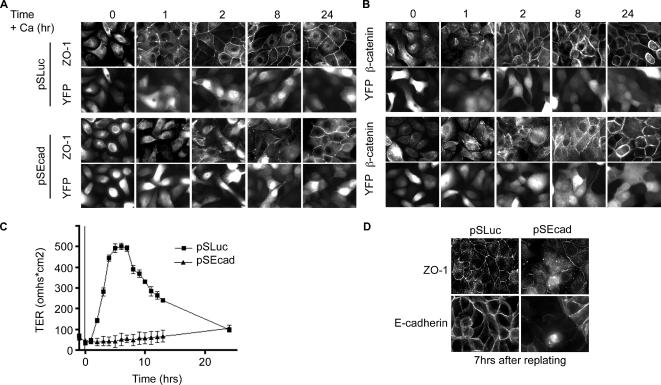
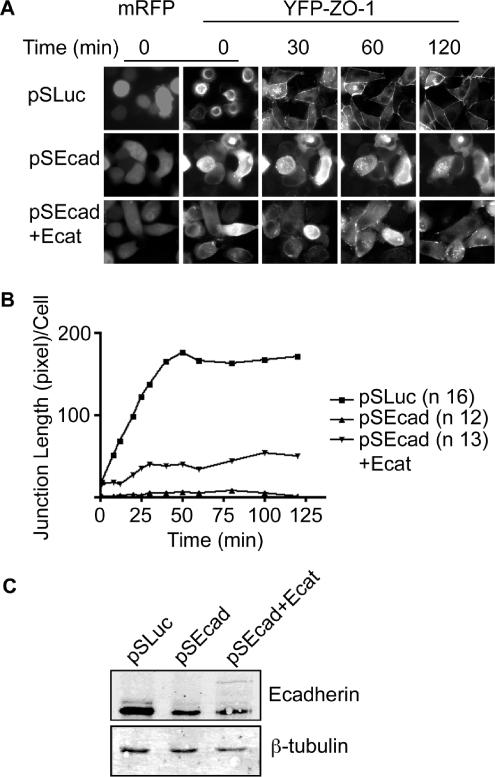
E-cadherin forms calcium-dependent homophilic intercellular adhesions between epithelial cells. These contacts regulate multiple aspects of cell behavior, including the organization of intercellular tight junctions (TJs). To distinguish between the roles of E-cadherin in formation versus maintenance of junctions, Madin-Darby canine kidney (MDCK) cells were depleted of E-cadherin by RNA interference. Surprisingly, reducing E-cadherin expression had little effect on the protein levels or localization of adherens junction (AJ) or TJ markers. The cells underwent morphological changes, as the normally flat apical surface swelled into a dome. However, apical-basal polarity was not compromised, transmembrane resistance was normal, and zonula occludin protein 1 dynamics at the TJs were unchanged. Additionally, an E-cadherin/Cadherin-6 double knockdown also failed to disrupt established TJs, although beta-catenin was lost from the cell cortex. Nevertheless, cells depleted of E-cadherin failed to properly reestablish cell polarity after junction disassembly. Recovery of cell-cell adhesion, transepithelial resistance, and the localization of TJ and AJ markers were all delayed. In contrast, depletion of alpha-catenin caused long-term disruption of junctions. These results indicate that E-cadherin and Cadherin-6 function as a scaffold for the construction of polarized structures, and they become largely dispensable in mature junctions, whereas alpha-catenin is essential for the maintenance of functional junctions.


Figures

Figure 1.
Figure 1.
E-cadherin knockdown in MDCK cells. E-cadherin shRNAs were generated against canine E-cadherin sequence and expressed in MDCK cells. Control samples expressed shRNAs against luciferase (pSLuc). (A). Immunoblot of cell lysates 2 d posttransfection. β-tubulin was used as a loading control. (B). Western blot of cell lysates from control cells, and cells transfected with increasing amounts of pS-EcadB. The bottom panel shows quantitative measurements of E-cadherin depletion, adjusted for differences in gel loading. (C) Immunofluorescence staining of fixed control and KD cells. E-cadherin is silenced in cells coexpressing the YFP marker.
Figure 2.
Figure 2.
Cell–cell contacts are maintained in cells depleted of E-cadherin. Immunofluorescence staining of MDCK cells fixed 2 d posttransfection with E-cadherin pSEcad or pSLuc shRNAs. YFP expression is a transfection marker. (A) TJ marker proteins ZO-1, Pals1, Par3, and the transmembrane protein Claudin1 localize to cell–cell contacts in control and knockdown cells. (B) Adherens junction proteins E-cadherin, β-catenin, α-catenin, and actin localization at cell–cell contacts in both control and knockdown cells.
Figure 3.
Figure 3.
TJs are not disrupted in cells depleted of E-cadherin. (A) TER was measured up to 4 d posttransfection. Results are plotted for control (■) and knockdown cells (▴), as means of three independent experiments after background subtraction. Below is a representative Western blot of Cadherin expression over this time period. (B) Cell polarity is maintained in cells depleted of E-cadherin. MDCK cells grown on filters were fixed and stained 2 d posttransfection. Cells were imaged by confocal microscopy with 20 × 1 μm z-sections. Assembled images are viewed in cross-section, stained with the apical marker gp135 (green), or the basal–lateral marker Na+/K+ATPase (green). mRFP or YFP marks transfected cells. (C) 3-D–assembled confocal sections of control or E-cadherin knockdown cells. Apical surfaces are stained with gp135 (green), with mRFP as a transfection marker. (D) FRAP analysis of TJ stability in YFP-ZO-1 MDCK stable cell line. Confocal sections of cells expressing YFP-ZO-1 are shown before and at various time points after photobleaching. mRFP expression marks transfected cells and boxed areas at time point 1 indicate bleached region. (E) Quantification of FRAP in control (n = 6) and knockdown cells (n = 5).
Figure 4.
Figure 4.
Increased calcium sensitivity in E-cadherin–depleted cells. (A) YFP-ZO-1 becomes mislocalized at 100 μM extracellular calcium in cells depleted of E-cadherin. MDCK T23 cells stably expressing YFP-ZO-1 were transfected with vectors for mRFP plus pSLuc or pSEcad shRNAs. After 2 d, cells were switched to medium containing either 2 or 100 μM calcium (t = 0), and YFP-ZO-1 localization was monitored for up to 60 min. (B) MDCK cells expressing control (pSLuc) or E-cadherin shRNA along with YFP, were incubated in medium containing 100 μM calcium for 15 min. Fixed cells were stained with phalloidin to visualize actin structures. (C) E-cadherin depletion causes loss of TER at 100 μM calcium. Control (pS) and E-cadherin knockdown cells (KD) were plated on Transwell filters and allowed to grow to confluence. Cells were then incubated in medium containing 2 or 100 μM calcium. TER was measured for 60 min.
Figure 5.
Figure 5.
β-catenin is in excess of E-cadherin in MDCK cells. (A) Western blot analysis of whole cell lysates 2 d posttransfection with pSLuc or pSEcad vectors. Lysates were blotted for E-cadherin, β-catenin, and α-catenin to determine relative protein abundances. (B) β-catenin is in excess of E-cadherin in MDCK cells. TX-100 lysates from untransfected cells were analyzed by immunoblot after serial E-cadherin immunodepletion. (C) MDCK cells were lysed in a TX-100 lysis buffer, and samples of the insoluble (pellet) and soluble (sup) fractions were analyzed by immunoblot. The fraction of β-catenin in the insoluble pool does not change in cells after E-cadherin depletion. Soluble lysate fractions were immunoprecipitated with β-catenin antibody or mouse nonimmune antibody (NIIgG) as a control. Samples were blotted for β-catenin. (D) Immunoblot of cell lysates from control (pSLuc) or pS-Ecad–transfected cells. Lysates were blotted for E-cadherin and Pan-cadherin. β-tubulin is a loading control. (E) Whole cell lysates of control (pSLuc) and pSEcad cells blotted for Cadherin-6, E-cadherin, and β-tubulin.
Figure 6.
Figure 6.
Simultaneous suppression of Cadherin-6 and E-cadherin causes mislocalization of β-catenin, yet TJs are not disrupted. (A) Immunofluorescence of Cadherin-6 in MDCK cells fixed 2 d after transfection with E-cadherin (pSEcad) or pSLuc shRNA vectors. YFP is the transfection marker. (B) Immunoblot analysis of cell lysates from MDCK cells transfected with pSLuc or pSEcad, Cadherin-6 shRNA vector (pSCad6), or both pSEcad plus pSCad6. (C) Immunofluorescence images of MDCK cells depleted of Cadherin-6 or of both E-cadherin and Cadherin-6. Cells were fixed and stained with anti-Cadherin-6 or anti-E-cadherin to confirm cadherin suppression in transfected cells. Cellular localization of ZO-1, β-catenin, α-catenin, and actin is shown for both Cadherin-6 and double knockdown conditions. Transfected cells express YFP.
Figure 7.
Figure 7.
Suppression of α-catenin disrupts confluent MDCK cells. (A) Immunoblot of cell lysates 2 d posttransfection with control, α-catenin and/or E-cadherin shRNA vectors. (B) DIC image of MDCK cells at low confluence (top) or high confluence (bottom) transfected with either control or α-catenin shRNA vectors. (C) Immunofluorescence images of α-catenin–depleted MDCK cells stained for α-catenin, ZO-1, β-catenin, and E-cadherin. YFP was a transfection marker. (D) Recompiled confocal sections of α-catenin–depleted cells grown on filters. Cells were fixed and stained for the apical marker gp135 (green). mRFP was used as a transfection marker (red). The right-hand panels are cross-sections of the same image.
Figure 8.
Figure 8.
TJ biogenesis is disrupted in cells depleted of E-cadherin. E-cadherin knockdown cells fail to polarize properly after calcium switch. (A) Immunofluorescence of MDCK cells 2 d after transfection with control shRNA and YFP. (B) E-cadherin–depleted cells fixed and stained 2 d after transfection. Cells were stained for ZO-1 and β-catenin. YFP marks transfected cells. (C) Average TER after calcium switch for control (■) and knockdown cells (▴). (D) Trypsinized and replated cells were analyzed by immunofluorescence for TJ formation. Cells were fixed 7 h after replating and stained for E-cadherin and ZO-1.
Figure 9.
Figure 9.
E-cadherin knockdown is partially rescued by E-cadherin–α-catenin fusion protein. (A) Live cell time-lapse imaging of YFP-ZO-1 MDCK cells after calcium switch. Cells were transfected with vectors for control or E-cadherin shRNAs or the E-cadherin–α-catenin fusion protein (Ecat). mRFP marks transfected cells. Videos are available in Supplementary Material. (B) Quantification of ZO-1 length as a measure of TJ recovery (pixels per cell). Average lengths are recorded up to 120 min after calcium switch for control cells (■) E-cadherin depleted cells (▴) and depleted cells plus an E-cadherin–α-catenin fusion protein (▾). (C) Immunoblot of cell lysates from YFP-ZO-1 cells transfected with pSLuc, pSEcadB, or pSEcadB vectors plus the E-cadherin–α-catenin fusion protein.

Similar articles

Cited by

References

    1. Adams C. L., Nelson W. J. Cytomechanics of cadherin-mediated cell-cell adhesion. Curr. Opin. Cell Biol. 1998;10:572–577. - PubMed
    1. Ando-Akatsuka Y., Yonemura S., Itoh M., Furuse M., Tsukita S. Differential behavior of E-cadherin and occludin in their colocalization with ZO-1 during the establishment of epithelial cell polarity. J. Cell Physiol. 1999;179:115–125. - PubMed
    1. Angres B., Barth A., Nelson W. J. Mechanism for transition from initial to stable cell-cell adhesion: kinetic analysis of E-cadherin-mediated adhesion using a quantitative adhesion assay. J. Cell Biol. 1996;134:549–557. - PMC - PubMed
    1. Bershadsky A. Magic touch: how does cell-cell adhesion trigger actin assembly? Trends Cell Biol. 2004;14:589–593. - PubMed
    1. Boggon T. J., Murray J., Chappuis-Flament S., Wong E., Gumbiner B. M., Shapiro L. C-cadherin ectodomain structure and implications for cell adhesion mechanisms. Science. 2002;296:1308–1313. - PubMed

Publication types