. 2007 Jan;18(1):253-64.
doi: 10.1091/mbc.e06-03-0207. Epub 2006 Nov 8.

FAK potentiates Rac1 activation and localization to matrix adhesion sites: a role for betaPIX

Affiliations

FAK potentiates Rac1 activation and localization to matrix adhesion sites: a role for betaPIX

Fumin Chang et al. Mol Biol Cell. 2007 Jan.

Abstract

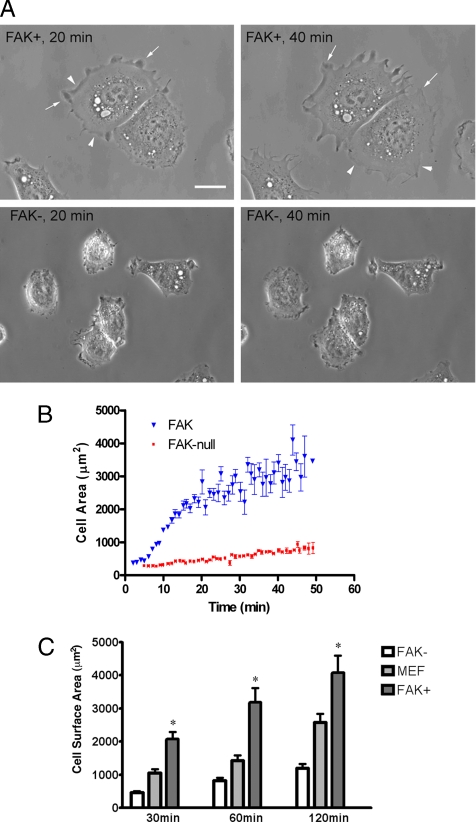
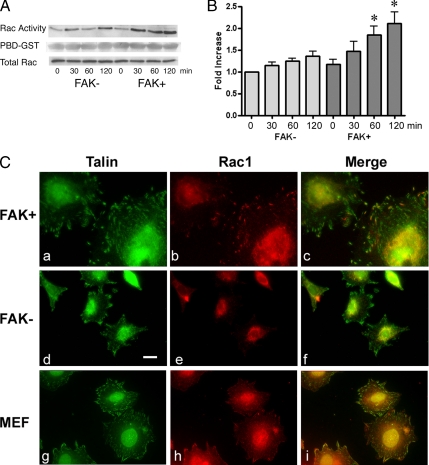
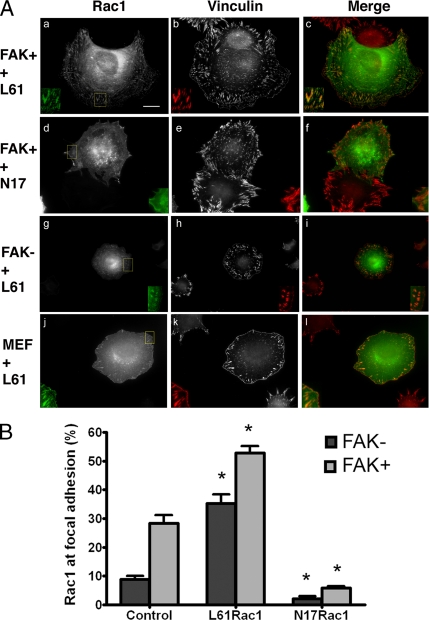
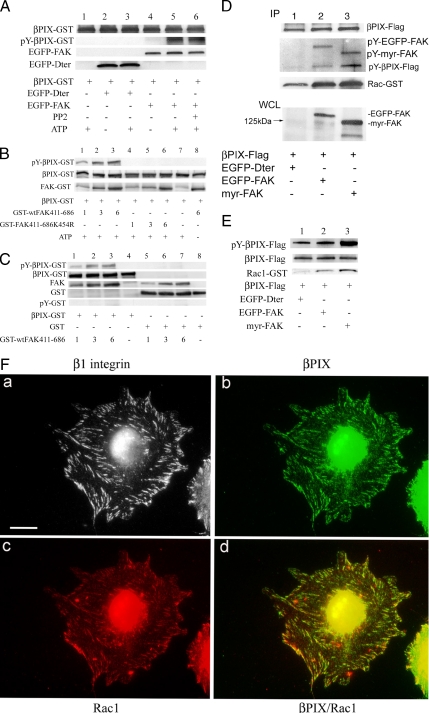
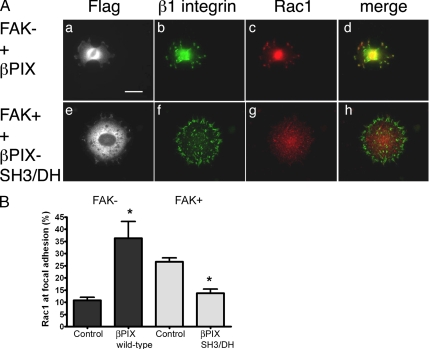
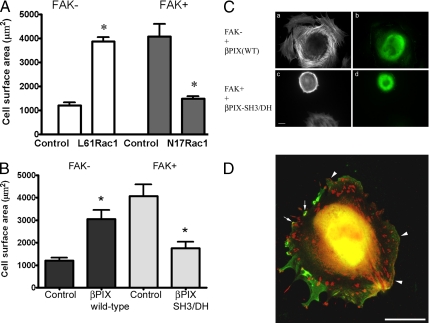
FAK, a cytoplasmic protein tyrosine kinase, is activated and localized to focal adhesions upon cell attachment to extracellular matrix. FAK null cells spread poorly and exhibit altered focal adhesion turnover. Rac1 is a member of the Rho-family GTPases that promotes membrane ruffling, leading edge extension, and cell spreading. We investigated the activation and subcellular location of Rac1 in FAK null and FAK reexpressing fibroblasts. FAK reexpressers had a more robust pattern of Rac1 activation after cell adhesion to fibronectin than the FAK null cells. Translocation of Rac1 to focal adhesions was observed in FAK reexpressers, but seldom in FAK null cells. Experiments with constitutively active L61Rac1 and dominant negative N17Rac1 indicated that the activation state of Rac1 regulated its localization to focal adhesions. We demonstrated that FAK tyrosine-phosphorylated betaPIX and thereby increased its binding to Rac1. In addition, betaPIX facilitated the targeting of activated Rac1 to focal adhesions and the efficiency of cell spreading. These data indicate that FAK has a role in the activation and focal adhesion translocation of Rac1 through the tyrosine phosphorylation of betaPIX.


Figures

Figure 1.
Figure 1.
FAK null cells spread poorly on fibronectin. (A) FAK+ and FAK− fibroblasts were plated onto fibronectin-coated dishes. Phase-contrast images acquired at 20 and 40 min are shown. FAK+ cells (top panels) rapidly established broad lamellipodia as indicated by the arrows and membrane ruffles (arrowheads). Both of these features failed to develop well in FAK− cells (bottom panels). Scale bar, 10 μm. (B) Cell spreading rates were determined by measuring surface area as a function of time for both FAK+ (▾, n = 11) and FAK− cells (■, n = 9) by phase-contrast microscopy. After initial attachment (∼5–7 min), cells were perfused with media at ∼2 ml/min. Images were collected at 1-min intervals up to 50 min. Mean surface area data (±SE) are shown for each time point. Compared with their FAK− counterparts, FAK+ cells spread at nearly twice the rate to a maximum area more than three times as large. (C) FAK−, MEF, and FAK+ fibroblasts were plated onto fibronectin-coated coverslips for 30, 60, or 120 min. Images of cells labeled with rhodamine-conjugated phalloidin were used for cell size quantification with Openlab software. Cell surface area units are μm2. FAK+ fibroblasts were larger than FAK− cells at each time point indicated by an asterisk (*p < 0.001).
Figure 2.
Figure 2.
FAK increased Rac1 activation and translocation to focal adhesions. (A) FAK− and FAK+ (left and right 4 lanes, respectively) fibroblasts were plated on fibronectin-coated dishes for the times indicated (0 min = suspension). A PBD-GST affinity pulldown Rac1 activity assay was done on 500 μg of protein from each lysate (top row). Coomassie blue staining of the membrane verified the addition of an equal amount of PBD-GST substrate to each sample (middle row). Western blotting of separate portions of each whole-cell lysate showed equal amounts of total Rac1 from each cell type at all studied time points (bottom row). Rac activation was more prominent in FAK+ cells. (B) Three sets of Rac activity assay results were used for densitometry and statistical analysis of the differences in adhesion-induced Rac1 activation between FAK− and FAK+ cells (left and right 4 bars, respectively). Blots were scanned using an Epson scanner (model 2450) and the intensity of each of the active Rac1 bands pulled down by the PBD-GST was normalized to the total cellular Rac protein band and calculated by a software-based algorithm using NIH image software (version 1.62). Rac1 activity of FAK− cells at 0 min was assigned the value of 100%, and relative values are shown for the other samples. SE bars are shown. Asterisks indicate a significant increase in Rac1 activity in FAK+ cells compared with FAK− cells at the same time point (p < 0.05). (C) FAK+ (a–c), FAK− (d–f), and MEF (g–i) cells were plated on FN-coated coverslips for 2 h before fixation and preparation for immunofluorescence analysis. Talin is shown in green (FITC channel data; a, d, and g), and Rac1 is shown in red (Cy5 channel data; b, e, and h). Colocalization appears yellow-orange in the merged images shown in c, f, and i. Rac1 was seen in focal adhesions in FAK+ cells and MEF more often than in FAK− cells. Scale bar, 10 μm.
Figure 3.
Figure 3.
Rac1 activity and focal adhesion targeting: (A) FAK+ (a–c), FAK− (g–i), and MEF (j–l) cells were transfected with GFP-tagged L61Rac1. FAK+ cells were transfected with GFP-tagged N17Rac1 (dominant negative, d–f). Two days later cells were plated onto fibronectin-coated coverslips for 2 h and prepared for immunofluorescence studies. GFP-Rac1 signal (a, d, g, and j) and vinculin antibody labeling (b, e, h, and k; Cy5 channel data) are shown. GFP-Rac is shown in green, vinculin is shown in red, and colocalization appears yellow-orange in the merged images in panels c, f, i, and l. The boxed areas in a, d, g, and j were magnified (2×) and are shown in individual insets for each panel. Scale bar, 10 μm. (B) An automated image analysis routine (see Materials and Methods) was used to measure the percentage of focal adhesion surface area occupied by endogenous Rac1 in nontransfected FAK− and FAK+ cells (pair of bars at left, n = 22 FAK− and 22 FAK+), and by the ectopically expressed L61Rac1 (middle pair of bars, n = 10 FAK− and 6 FAK+), or N17Rac1 (pair of bars at right, n = 6 FAK− and 5 FAK+). Bars are SEs. Asterisks indicate statistically significant differences from cell type-matched nontransfected controls (p < 0.01 in all cases, details in text).
Figure 4.
Figure 4.
FAK association with βPIX and FAK-mediated tyrosine-phosphorylation of βPIX. (A) FAK− cells were transfected with EGFP-tagged wild-type FAK (lanes 4–6), the FAK mutant Dter that lacks a kinase domain (lanes 2–3), or nothing (lane 1). EGFP-Dter and EGFP-FAK were immunoprecipitated using anti-GFP antibody and protein A-Sepharose. About 2 μg of purified βPIX-GST was then added to each sample containing mock, EGFP-Dter, or EGFP-FAK immunoprecipitates for an in vitro kinase assay in the presence of 20 μM ATP (omitted in lanes 2 and 4). The kinase reaction mixture was analyzed by SDS-PAGE and serial immunoblotting with anti-GFP, anti-βPIX, and pY20 antibodies. FAK-mediated tyrosine phosphorylation of βPIX is shown. Lane 6 shows no change in the tyrosine phosphorylation of βPIX by FAK in the presence of the Src inhibitor PP2 (10 μM). (B) Purified FAK tyrosine-phosphorylates βPIX-GST in vitro. Purified βPIX-GST, 2 μg, was incubated with 1, 3, or 6 μg of purified GST-tagged wild-type FAK (GST-wtFAK411-686; lanes 1–3, respectively, and 6 μg in lane 8) or kinase dead FAK mutant (GST-FAK411-686K454R; lanes 4–6) in kinase buffer for 30 min at 37°C in the presence of 20 μM ATP (omitted in lane 8). The kinase reaction mixture was analyzed by SDS-PAGE and immunoblotting with anti-GST and pY20 antibodies. No FAK was used in lane 7. Wild-type FAK kinase domain, but not the kinase dead FAK mutant, tyrosine-phosphorylated βPIX-GST in a dose-dependent manner. (C) FAK specifically tyrosine-phosphorylates βPIX. Purified βPIX-GST (2 μg, lanes 1–4) or 4 μg of purified GST (lanes 5–8) were incubated with 1, 3, 6, or 0 μg of purified GST-wtFAK411-686 (lanes 1 and 5, 2 and 6, 3 and 7, and 4 and 8, respectively) in kinase buffer for 30 min at 37°C in the presence of 20 μM ATP. The kinase reaction mixture was analyzed by SDS-PAGE and immunoblotting with anti-GST and pY20 antibodies. Wild-type FAK tyrosine-phosphorylated βPIX-GST but not the GST alone in a dose-dependent manner. (D) FAK null cells were cotransfected with Flag-tagged wild-type βPIX and either EGFP-Dter (lanes labeled 1), EGFP-FAK (lanes labeled 2), or myristylated-FAK (lanes labeled 3). Two days later, βPIX-Flag was immunoprecipitated using anti-Flag antibody from lysates of each cell population that had been normalized for total protein. βPIX-Flag immunoprecipitates were then incubated with purified recombinant Rac1-GST. These samples were then processed by SDS-PAGE, transferred to nitrocellulose, and Western-blotted with an anti-phosphotyrosine antibody (rows 2–4). Then, the membrane was stripped and reprobed with anti-Rac1 antibody (bottom row). Finally, the immunoprecipitates were immunoblotted for βPIX-Flag (top row). At the bottom of the figure, whole-cell lysates (WCL) from cells transfected as detailed beneath the figure were immunoblotted with an anti-FAK antibody. (E) SYF cells were cotransfected with Flag-tagged wild-type βPIX and either EGFP-Dter (lanes labeled 1), EGFP-FAK (lanes labeled 2), or myristylated-FAK (lanes labeled 3). This experiment was similar in design to the FAK− cell experiment in D. βPIX-Flag was immunoprecipitated using anti-Flag antibody from lysates of each cell population and βPIX-Flag immunoprecipitates were then incubated with purified recombinant Rac1-GST. These samples were then processed by SDS-PAGE, transferred to nitrocellulose, and immunoblotted with an anti-phosphotyrosine antibody (row 1). Then, the membrane was stripped and reprobed with anti-Rac1 antibody (third row). Finally, the immunoprecipitates were immunoblotted for βPIX-Flag (middle row). (F) FAK+ cells (without transfection) were plated onto fibronectin-coated coverslips for 2 h and prepared for immunofluorescence analysis of β1 integrin (a), βPIX (b), and Rac1 (c) localization using antibodies raised in rat, rabbit, and mouse, respectively. Affinity cross-adsorbed secondary antibodies were used to label these three targets as follows: β1 integrin with rhodamine (shown in gray scale), βPIX with Cy5 (shown in green), and Rac1 with FITC (shown in red). Panel d is a merge of the βPIX and Rac1 images, and colocalization appears yellow-orange. Scale bar, 10 μm.
Figure 5.
Figure 5.
βPIX and Rac1 targeting. (A) FAK− cells that were transfected with Flag-tagged wild-type βPIX (top row) and FAK+ cells that were transfected with Flag-tagged double mutant βPIX-SH3/DH (bottom row) were plated on fibronectin-coated glass 48 h after transfection. After 2 h, samples were fixed and labeled with rabbit anti-Flag (a and e), rat anti-β1 integrin (b and f), and mouse anti-Rac1 (c and g) antibodies. Merged images of β1 integrin and Rac1 data are shown at the right (d and h). Scale bar, 10 μm. (B) The percentage of the total focal adhesion area per cell that was occupied by endogenous Rac1 was determined by the Openlab automation detailed in Materials and Methods. Total focal adhesion surface area was derived from β1 integrin staining. Wild-type βPIX expression tripled Rac1 focal adhesion targeting in FAK− cells (n = 22 controls and 5 transfected cells). In FAK+ cells, βPIX-SH3/DH expression halved Rac1 translocation to focal adhesions. Data shown are means ± SEs. (n = 37 controls and 15 transfected cells). *p < 0.01.
Figure 6.
Figure 6.
βPIX and cell spreading. (A) Cell surface area was quantified from phalloidin-labeled cell images using Openlab software in FAK− cells transfected with GFP-tagged constitutively active Rac1 (L61) and in FAK+ cells transfected with GFP-tagged dominant negative Rac1 (N17). Fixation and labeling were done after 2 d in culture, and cells were plated on fibronectin for 2 h before study. GFP signal was used to identify transfected cells. Constitutively active Rac1 (L61) expression was associated with an increase in mean surface area to three times that of untreated FAK− cells (n = 25 control cells and 8 transfected cells). Dominant negative Rac1 (N17) expression caused a 64% reduction in mean spread cell area in FAK+ cells (n = 9 control cells and 8 transfected cells). Data shown are means ± SEs. *p < 0.001. (B) Cell surface area was quantified from phalloidin-labeled cell images using Openlab software in FAK− cells transfected with wild-type βPIX-Flag and in FAK+ cells transfected with βPIX-SH3/DH-Flag. Fixation and labeling were done after 2 d in culture, and cells were plated on fibronectin for 2 h before study. Anti-Flag antibody staining was used to identify transfected cells. Wild-type βPIX expression was associated with a twofold increase in mean surface area in FAK− cells (n = 21 control cells and 9 transfected cells). βPIX-SH3/DH-Flag caused a 50% reduction in mean spread cell area in FAK+ cells (n = 9 control cells and 14 transfected cells). Data shown are means ± SEs. *p < 0.01. (C) FAK− cells transfected with Flag-tagged wild-type βPIX (top row), and FAK+ cells transfected with Flag-tagged double mutant βPIX-SH3/DH (bottom row), were plated on fibronectin-coated glass 48 h after transfection. After 2 h, samples were fixed and labeled for immunofluorescence. Rhodamine phalloidin–labeled images show F-actin (a and c), and anti-Flag antibody labeling shows the transfected cells (b and d). Scale bar, 10 μm. (D) Wild-type βPIX-Flag (anti-Flag antibody and FITC labeling, shown in green) and vinculin (Cy5 labeling, shown in red) are shown in a transfected FAK− cell. Colocalization appears yellow-orange and is seen in focal adhesions (arrows) and in clusters of focal complexes in membrane ruffles (arrowheads). Scale bar, 10 μm.

Similar articles

Cited by

References

    1. Arthur W. T., Petch L. A., Burridge K. Integrin engagement suppresses RhoA activity via a c-Src-dependent mechanism. Curr. Biol. 2000;10:719–722. - PubMed
    1. Benard V., Bohl B. P., Bokoch G. M. Characterization of rac and cdc42 activation in chemoattractant-stimulated human neutrophils using a novel assay for active GTPases. J. Biol. Chem. 1999;274:13198–13204. - PubMed
    1. Brown M. C., Cary L. A., Jamieson J. S., Cooper J. A., Turner C. E. Src and FAK kinases cooperate to phosphorylate paxillin kinase linker, stimulate its focal adhesion localization, and regulate cell spreading and protrusiveness. Mol. Biol. Cell. 2005;16:4316–4628. - PMC - PubMed
    1. Brown M. C., West K. A., Turner C. E. Paxillin-dependent paxillin kinase linker and p21-activated kinase localization to focal adhesions involves a multistep activation pathway. Mol. Biol. Cell. 2002;13:1550–1565. - PMC - PubMed
    1. Burridge K., Turner C. E., Romer L. H. Tyrosine phosphorylation of paxillin and pp125FAK accompanies cell adhesion to extracellular matrix: a role in cytoskeletal assembly. J. Cell Biol. 1992;119:893–903. - PMC - PubMed

Publication types

MeSH terms

Substances