Comparative Study
. 2006 Nov 8;26(45):11532-9.
doi: 10.1523/JNEUROSCI.2688-06.2006.

Neural cell adhesion molecule L1-transfected embryonic stem cells promote functional recovery after excitotoxic lesion of the mouse striatum

Affiliations
Comparative Study

Neural cell adhesion molecule L1-transfected embryonic stem cells promote functional recovery after excitotoxic lesion of the mouse striatum

Christian Bernreuther et al. J Neurosci. .

Abstract

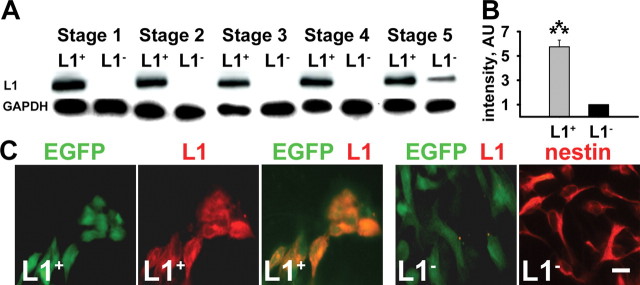
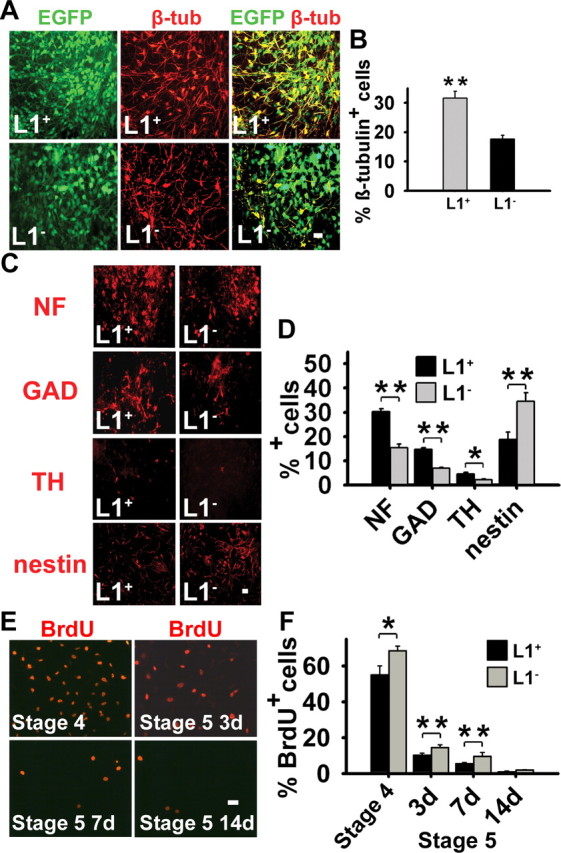
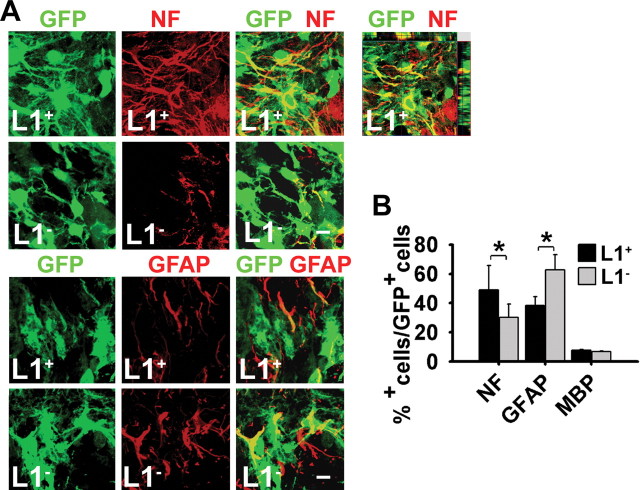
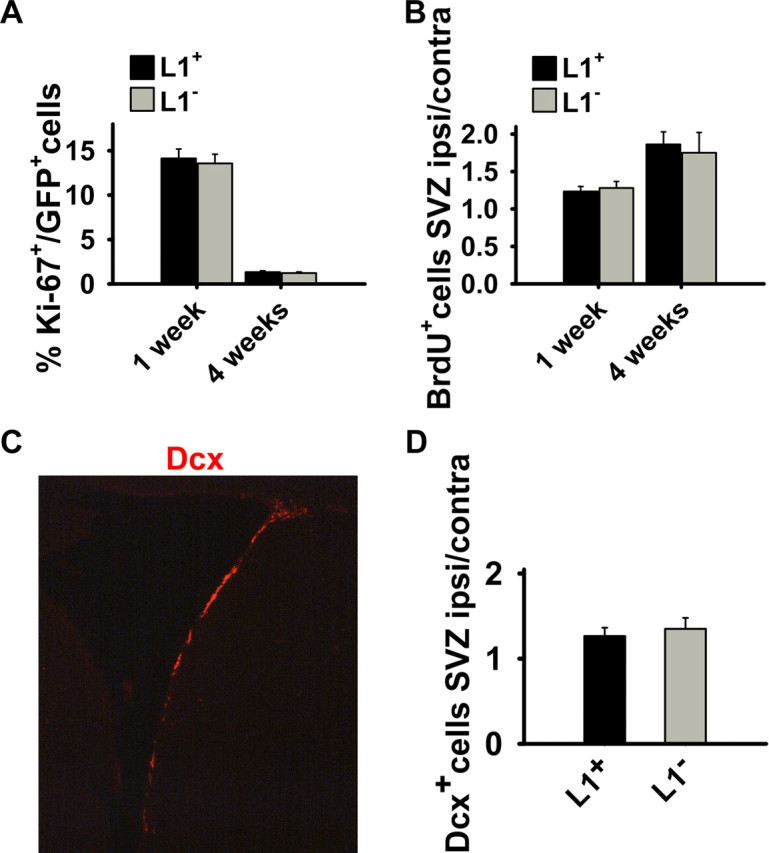
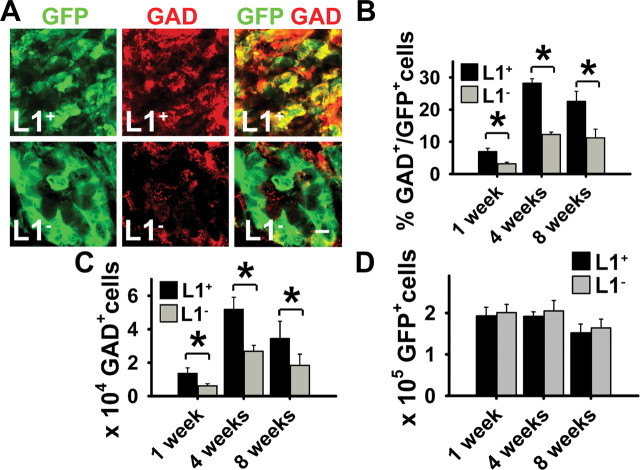
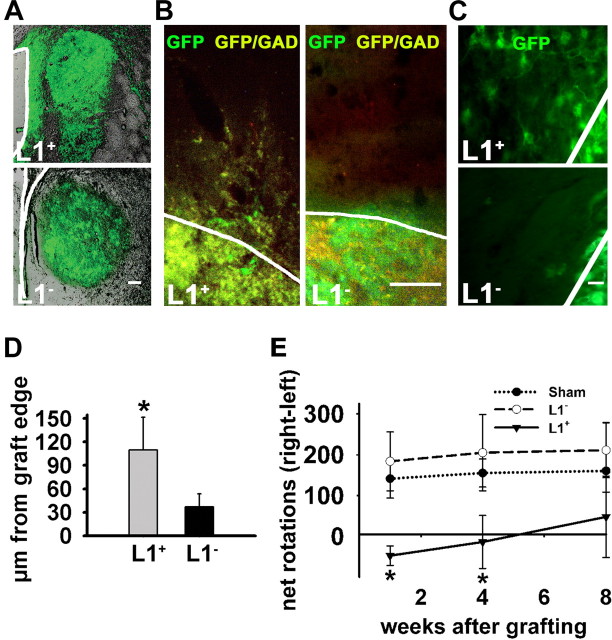
We have generated a murine embryonic stem cell line constitutively expressing L1 at all stages of neural differentiation to investigate the effects of L1 overexpression on stem cell proliferation, migration, differentiation, cell death, and ability to influence drug-induced rotation behavior in an animal model of Huntington's disease. L1-transfected cells showed decreased cell proliferation in vitro, enhanced neuronal differentiation in vitro and in vivo, and decreased astrocytic differentiation in vivo without influencing cell death compared with nontransfected cells. L1 overexpression also resulted in an increased yield of GABAergic neurons and enhanced migration of embryonic stem cell-derived neural precursor cells into the lesioned striatum. Mice grafted with L1-transfected cells showed recovery in rotation behavior 1 and 4 weeks, but not 8 weeks, after transplantation compared with mice that had received nontransfected cells, thus demonstrating for the first time that a recognition molecule is capable of improving functional recovery during the initial phase in a syngeneic transplantation paradigm.


Figures

Figure 1.
Figure 1.
Transfected ES cells express L1 at all stages of differentiation. A, Immunoblot analysis of L1 expression in transfected (L1 +) and mock-transfected (L1 ) GFP + ES cells differentiated by the five-stage differentiation protocol at day 2 of stages 1 and 2, day 6 of stages 3 and 4, and day 7 of stage 5. Note that transgenic L1 is expressed throughout all stages of differentiation. Immunoblot analysis of glyceraldehyde 3-phosphate dehydrogenase (GAPDH) is shown as a loading control. B, Quantification of the intensity in the immunoblot analysis of L1 expression in stage 5. Arbitrary units (AU) normalized for L1 expression in L1 cells are shown (mean ± SEM). Student's t test was performed for statistical analysis (***p < 0.001). C, L1 overexpression at the cell surface was evaluated using anti-L1 (red) immunostaining and fluorescence light microscopy of live L1 and L1 + cells at stage 4. Note the expression of GFP (green) in L1 and L1 + cells. Neural differentiation of ES cells was confirmed by immunostaining of cells differentiated to stage 4 for nestin (red). Scale bar, 10 μm. EGFP, Enhanced GFP.
Figure 2.
Figure 2.
L1 expression increases neuronal differentiation and decreases proliferation in vitro. A, Generation of neurons from L1 and L1 + ES cells was determined at day 7 of stage 5 by immunostaining for β-tubulinIII (β-tub; red). GFP + cells, green; β-tubulinIII/GFP + cells, yellow. The proportion of β-tubulinIII + cells of all GFP + cells was greater in L1 + cells than in L1 cells. Scale bar, 20 μm. EGFP, Enhanced GFP. B, Percentages of β-tubulinIII + cells of all GFP + cells are shown at day 7 of stage 5 (mean ± SEM). Student's t test was performed for statistical analysis (**p < 0.01). C, At day 14 of stage 5, mature neuronal proteins NF-200 (NF), GAD, and TH and the neural stem cell protein nestin (all in red) were determined by immunocytochemistry in L1 and L1 + cells. The proportion of NF +, GAD +, and TH + cells was greater in the L1 + than in the L1 cells, whereas the proportion of nestin + cells was higher in L1 cells. Scale bar, 10 μm. D, Percentages of NF +, GAD +, TH +, and nestin + cells at day 14 of stage 5 (mean ± SEM). *p < 0.05, **p < 0.01 (Student's t test). E, BrdU incorporation was determined at day 7 of stage 4 and at days 3, 7, and 14 of stage 5 by immunostaining for BrdU (red) after a pulse labeling of 8 h with 10 mm BrdU. Scale bar, 10 μm. F, Percentages of BrdU + cells of all cells are shown at day 7 of stage 4 and days 3, 7, and 14 of stage 5 (mean ± SEM). Student's t test was performed for statistical analysis (*p < 0.05; **p < 0.01). 3d, Day 3; 7d, day 7; 14d, day 14.
Figure 3.
Figure 3.
L1 + cells grafted into the quinolinic acid-lesioned striatum show increased neuronal differentiation. A, Laser-scanning microscopy illustrating immunohistochemical analysis of grafts of early stage 5 cells derived from L1 and L1 + ES cells with the neuronal marker NF and the astrocytic marker GFAP (all in red) 4 weeks after transplantation of GFP + (green) cells. Donor-derived marker + cells in merged images appear yellow. NF staining of an L1 + graft with Z-series is displayed at top right. Note the increased expression of NF and the decreased expression of GFAP in L1 + grafts compared with L1 grafts. Scale bar, 10 μm. B, Percentages of cell type-specific marker + cells in L1 + (n = 6) or L1 (n = 6) grafts 4 weeks after transplantation (mean ± SEM). *p < 0.05 (Student's t test).
Figure 4.
Figure 4.
Analysis of proliferation in grafted cells by Ki-67 immunolabeling and of neurogenesis in the SVZ by BrdU incorporation and expression of DCX 1 and 4 weeks after transplantation. A, The fraction of Ki-67 + cells of all GFP + transplanted cells is given 1 and 4 weeks after transplantation of L1 + (n = 4) and L1 (n = 4) cells. No difference was observed. B, Mice transplanted with L1 + (n = 4) or L1 (n = 4) cells into the lesioned striatum were labeled with BrdU on days 3–7 after transplantation and killed 7 d and 4 weeks after grafting. The ratio of BrdU + cells in the SVZ ipsilateral and contralateral to the lesioned hemisphere is shown 1 and 4 weeks after transplantation. No difference was observed between the L1 + and L1 groups. C, Immunohistochemical staining for DCX (red) in the SVZ ipsilateral to the lesion in sham-injected animals 4 weeks after grafting. D, Immunostaining for DCX in the SVZ was assessed 4 weeks after grafting. The ratio of DCX + cells in the SVZ ipsilateral and contralateral to the lesioned and transplanted hemisphere is given for mice transplanted with L1 + (n = 4) or L1 (n = 4) cells into the lesioned striatum. No difference between L1 + and L1 groups was observed. Error bars indicate SEM. ipsi, Ipsilateral; contra, contralateral.
Figure 5.
Figure 5.
The number of GABAergic neurons is increased in L1 + grafts. A, Laser-scanning microscopy illustrating immunohistochemical analysis of grafts of early stage 5 cells derived from L1 and L1 + ES cells with the neuronal markers GAD (red) 8 weeks after transplantation of GFP + (green) cells. Donor-derived marker + cells in merged images appear yellow. Scale bar, 10 μm. B, Percentages of GAD + cells of GFP + cells in L1 + (n = 16) or L1 (n = 16) grafts 1–8 weeks after transplantation. ANOVA followed by Student's t test was performed for statistical analysis (*p < 0.05). C, Total number of GAD + cells per graft 1–8 weeks after transplantation. ANOVA followed by Student's t test was performed for statistical analysis (*p < 0.05). Note the increased number of GAD + cells in L1 + grafts 1–8 weeks after transplantation compared with L1 grafts and the number of GAD + cells in both groups decreasing 8 weeks after transplantation and reflecting a decrease in total cell number. D, Total numbers of graft-derived GFP + cells per graft 1–8 weeks after transplantation. Error bars indicate mean ± SEM.
Figure 6.
Figure 6.
L1 + cells migrate better than L1 cells and improve locomotory recovery after quinolinic acid lesioning. A, Photomicrographs of an L1 + and an L1 graft 4 weeks after transplantation. Transplants in green are shown in the corresponding bright-field image of the host brain. Lateral ventricles are delineated by white lines. Note the increased amount of migrated cells in the L1 + graft. B, Images from the periphery of GFP + transplants stained with GAD antibody (GFP +GAD + cells appear yellow) show cells that have emigrated from the transplant core 4 weeks after grafting. White lines indicate graft edges. C, Images from the periphery of GFP + transplants 4 weeks after grafting. White lines indicate graft edges. D, Average migration distance of transplanted cells from the edge of the graft 1 month after grafting of L1 + (n = 6) and L1 (n = 6) cells. Wilcoxon signed rank test was used to calculate significances (mean ± SEM; *p < 0.05). E, Analysis of amphetamine-stimulated rotations in animals with unilateral quinolinic acid-induced striatal lesion grafted with cells differentiated to day 3 of stage 5 derived from L1 (n = 11) or L1 + cells (n = 9) and sham-injected controls (n = 10). Net 360° rotations ipsilateral to the lesioned striatum were calculated as number of right rotations minus the number of left rotations. ANOVA followed by the Newman–Keuls test was performed for statistical analysis (mean ± SEM; *p < 0.05). Scale bars: A, 100 μm; B, 50 μm; C, 20 μm.

Similar articles

Cited by

References

    1. Appel F, Holm J, Conscience JF, Schachner M. Several extracellular domains of the neural cell adhesion molecule L1 are involved in neurite outgrowth and cell body adhesion. J Neurosci. 1993;13:4764–4775. - PMC - PubMed
    1. Barbin G, Aigrot MS, Charles P, Foucher A, Grumet M, Schachner M, Zalc B, Lubetzki C. Axonal cell-adhesion molecule L1 in CNS myelination. Neuron Glia Biol. 2004;1:65–72. - PubMed
    1. Bosch M, Pineda JR, Sunol C, Petriz J, Cattaneo E, Alberch J, Canals JM. Induction of GABAergic phenotype in a neural stem cell line for transplantation in an excitotoxic model of Huntington's disease. Exp Neurol. 2004;190:42–58. - PubMed
    1. Chen J, Bernreuther C, Dihné M, Schachner M. Cell adhesion molecule L1-transfected embryonic stem cells with enhanced survival support regrowth of corticospinal tract axons in mice after spinal cord injury. J Neurotrauma. 2005;22:896–906. - PubMed
    1. Chen S, Mantei N, Dong L, Schachner M. Prevention of neuronal cell death by neural adhesion molecules L1 and CHL1. J Neurobiol. 1999;38:428–439. - PubMed

Publication types

MeSH terms