Comparative Study
. 2006 Nov 8;26(45):11670-81.
doi: 10.1523/JNEUROSCI.3321-06.2006.

Protein kinase A-mediated synapsin I phosphorylation is a central modulator of Ca2+-dependent synaptic activity

Affiliations
Comparative Study

Protein kinase A-mediated synapsin I phosphorylation is a central modulator of Ca2+-dependent synaptic activity

Andrea Menegon et al. J Neurosci. .

Abstract

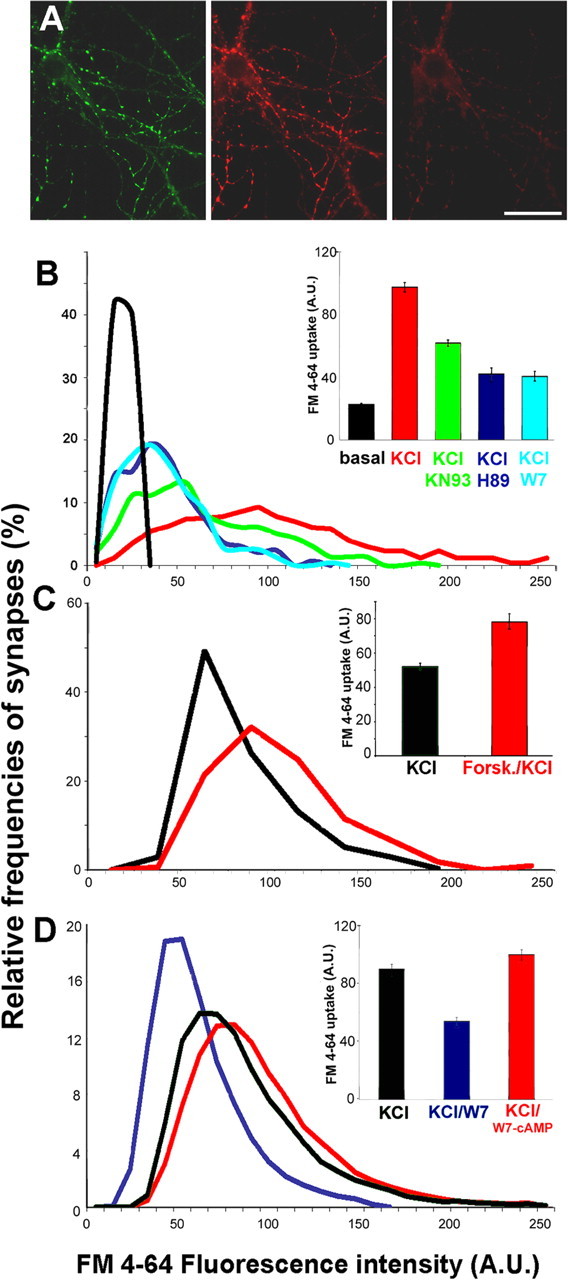
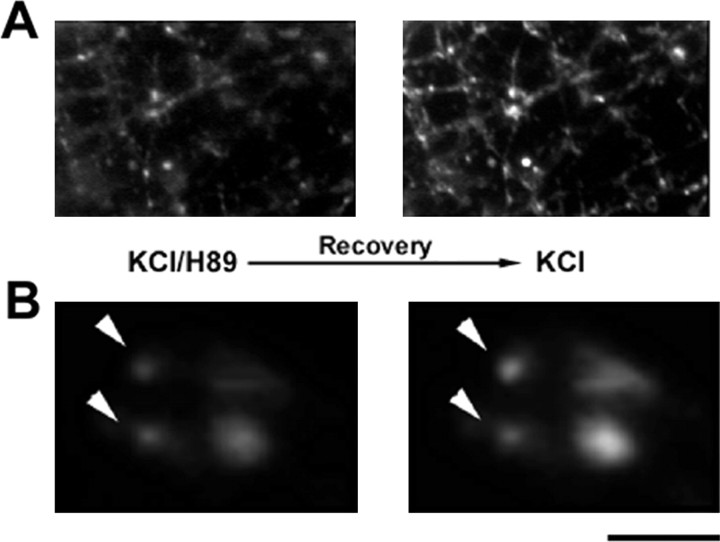
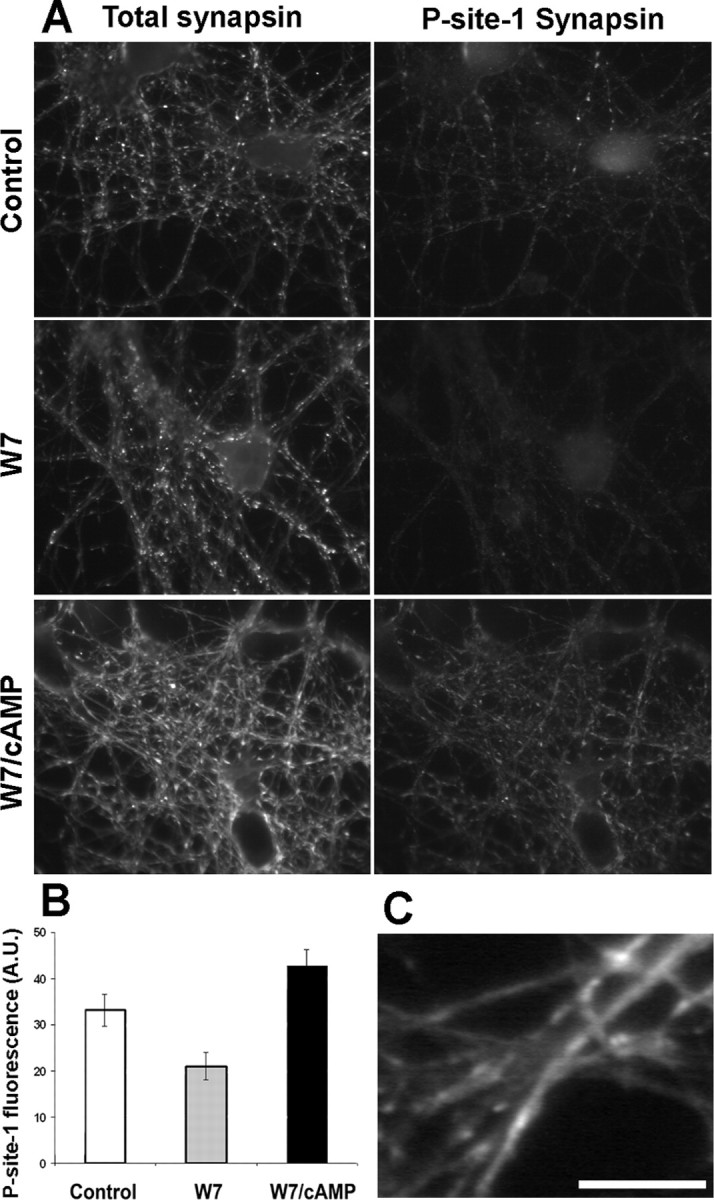
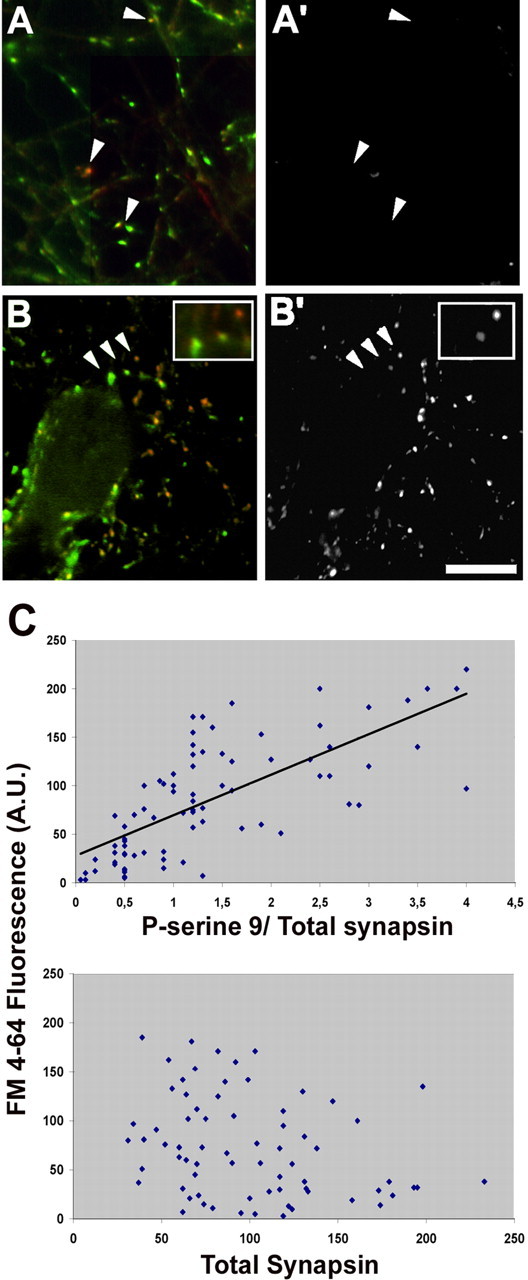
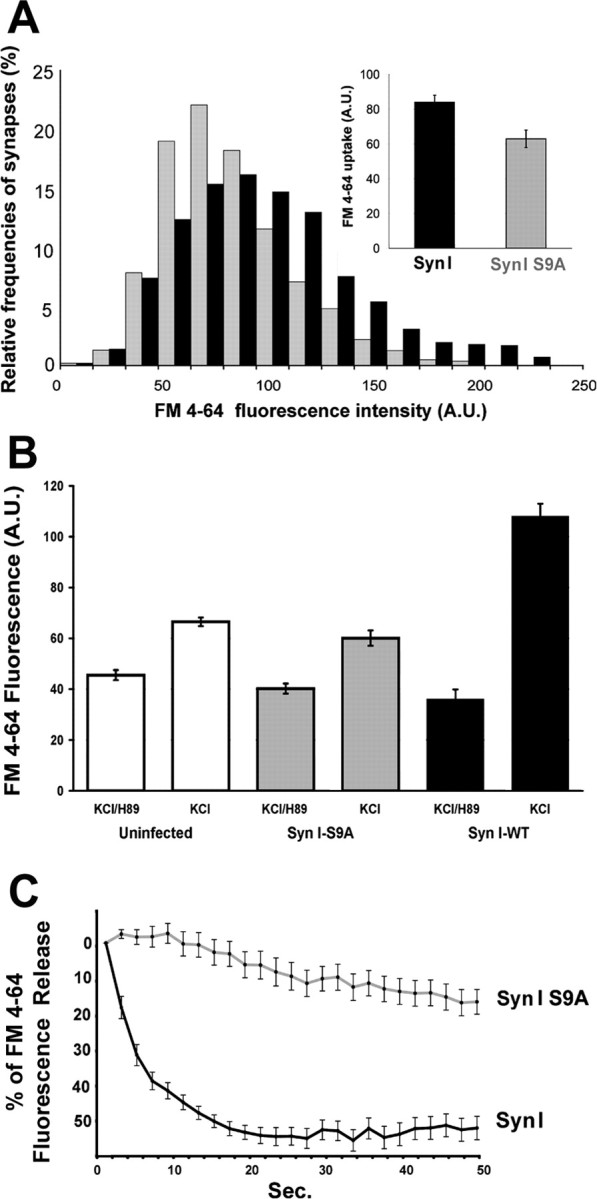
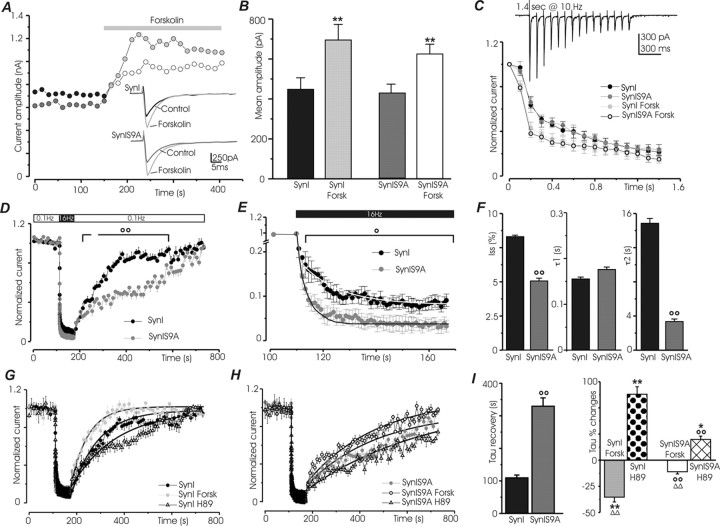
Protein kinase A (PKA) modulates several steps of synaptic transmission. However, the identification of the mediators of these effects is as yet incomplete. Synapsins are synaptic vesicle (SV)-associated phosphoproteins that represent the major presynaptic targets of PKA. We show that, in hippocampal neurons, cAMP-dependent pathways affect SV exocytosis and that this effect is primarily brought about through synapsin I phosphorylation. Phosphorylation by PKA, by promoting dissociation of synapsin I from SVs, enhances the rate of SV exocytosis on stimulation. This effect becomes relevant when neurons are challenged with sustained stimulation, because it appears to counteract synaptic depression and accelerate recovery from depression by fostering the supply of SVs from the reserve pool to the readily releasable pool. In contrast, synapsin phosphorylation appears to be dispensable for the effects of cAMP on the frequency and amplitude of spontaneous synaptic currents and on the amplitude of evoked synaptic currents. The modulation of depolarization-evoked SV exocytosis by PKA phosphorylation of synapsin I is primarily caused by calmodulin (CaM)-dependent activation of cAMP pathways rather than by direct activation of CaM kinases. These data define a hierarchical crosstalk between cAMP- and CaM-dependent cascades and point to synapsin as a major effector of PKA in the modulation of activity-dependent SV exocytosis.


Figures

Figure 1.
Figure 1.
PKA modulates SV recycling. A, Rat hippocampal neurons expressing SypI–EYFP (left) were loaded with FM4-64 by exposure for 1 min to KRH–55 mm KCl (depolarizing solution) (middle). Neurons were subsequently exposed to a second depolarizing stimulus to unload the dye (right). Scale bar, 20 μm. B–D, Quantitative analysis of FM4-64 uptake in SypI–EYFP-positive synapses. The intensity of FM4-64 uptake was measured at single synaptic boutons. The distributions of classes of FM4-64 fluorescence are shown as smoothened histograms, and the mean ± SE fluorescence values (n = 3 independent experiments) expressed in arbitrary units (A.U.) are shown in the inset with the corresponding color coding. B, Neurons were incubated for 30 min in KRH in the presence or absence of H89, KN93, or W7 and were then loaded with FM4-64 during a 1 min incubation in depolarizing solution; a 1 min incubation in KRH was used as control (black). p < 0.001 for KCl versus KCl/W7, KCl/H89, or KCl/KN93, Bonferroni's multiple comparison test (n = 250 synapses from 3 independent experiments). C, Quantitative analysis of FM4-64 uptake at SypI-EYFP-positive synapses elicited by a depolarizing stimulus applied for 30 s after a 10 min incubation in KRH in either the absence (black) or presence (red) of forskolin. p < 0.001, Bonferroni's multiple comparison test (n = 250 synapses from 3 independent experiments). D, Quantitative analysis of FM4-64 uptake at SypI–EYFP-positive synapses elicited by a depolarizing stimulus applied for 1 min after a 30 min incubation in the absence (black) or presence of either W7 (blue) or W7/dibutyryl-cAMP (red). p < 0.001, Bonferroni's multiple comparison test (n = 350 synapses from 3 independent experiments).
Figure 2.
Figure 2.
The effects of PKA inhibition on SV recycling are reversible. A, B, Rat hippocampal neurons were incubated for 30 min with H89 and subsequently loaded with FM4-64 by exposure to 55 mm KCl for 1 min (left column). After a 30 min incubation in the absence of H89 to recover from PKA inhibition and bleaching of the residual fluorescence, a second pulse of FM4-64 uptake was induced with the same depolarizing protocol (right column). Note the variability among individual synapses in the SV recycling activity reached on recovery from PKA inhibition (arrowheads in B). Scale bar: A, 15 μm; B, 5.5 μm.
Figure 3.
Figure 3.
PKA activation induces synapsin phosphorylation and diffusion along the axon. A–E, Hippocampal neurons were processed for double immunofluorescence with a phosphosite-1-specific anti-synapsin antibody (red) and an antibody that recognizes all synapsin isoforms (green). F, Neurons were stained with an anti-VAMP2 antibody (red) and a phosphosite-1-specific anti-synapsin antibody (green). Neurons were fixed in unstimulated conditions (A, A′) or after incubation with TTX (B, B′), H89 (C), forskolin (D, F), or forskolin plus KN93 (E). Under basal conditions, synapsin phosphorylation at site 1 can be detected in a subpopulation of synaptic boutons (arrowheads in A) as well as in growth cones (A′). Treatment of the neurons with TTX strongly reduces phosphorylation in nerve terminals (B) but not in growth cones (B′). Inhibition of PKA abolishes (C) whereas inhibition of CaM kinases only modestly decreases (E) synapsin phosphorylation. PKA activation induces site 1 phosphorylation and synapsin dispersion out of the terminals (D, F), whereas VAMP2 immunoreactivity remains confined to the synapses (F). G, Time-lapse experiment showing the dispersion of ECFP–SynI out of the synapses induced by forskolin (Forsk) and the recovery (Rec.) after removal of the drug. Scale bar: A, B, 10 μm; A′, B′, 15 μm; C–F, 20 μm; G, 5 μm.
Figure 4.
Figure 4.
Phosphorylation of synapsin at site 1 and synapsin dispersion occur independently of CaM-dependent enzymatic activities. A, Rat hippocampal neurons were fixed either at rest (control) or after a 30 min treatment with W7 in the presence or absence of dibutyryl-cAMP. Neurons were processed for double immunofluorescence with an antibody that recognizes all synapsin isoforms (left column) and a phosphosite-1-specific anti-synapsin antibody (right column). B, Histograms of the mean ± SE fluorescence intensities of site1-phosphorylated synapsin of the samples shown in A. A.U., Arbitrary units. C, High-magnification image of a sample treated with W7 and cAMP and processed as described in A. Note the diffusion of synapsin along the axons. Scale bar: A, 20 μm; C, 10 μm.
Figure 5.
Figure 5.
Depolarization-induced phosphorylation of synapsin at site 1 requires PKA activation. A–G, After incubation in the absence (A, B, F) or presence of H89 (C), W7 (D), or KN93 (E, G), rat hippocampal neurons were exposed to 55 mm KCl for 1 min, except for the sample shown in B, in which the depolarizing stimulus was applied for 2 min. Neurons were fixed and processed for double immunofluorescence with an antibody that recognizes all synapsin isoforms (A–G, green) and either a phosphosite-1-specific anti-synapsin antibody (A–E, red) or an antibody against autophosphorylated CaMKII (F, G, red). Note that depolarization-induced phosphorylation of synapsin at site 1 is inhibited by both H89 and W7 but not by KN93, although KN93 prevents CaMKII autophosphorylation. Scale bar, 15 μm.
Figure 6.
Figure 6.
Depolarization-induced SV recycling correlates with the intensity of synapsin phosphorylation at site 1. A–B′, Rat hippocampal neurons were loaded for 1 min with FM4-64 (A′, B′) in either KRH (A′) or depolarizing solution (B′), fixed, and processed for retrospective double immunofluorescence (A, B) with an antibody that recognizes all synapsin isoforms (green) and with a phosphosite-1-specific anti-synapsin antibody (red). Arrowheads in A and A′ point to unstimulated synapses showing a high level of site-1 phosphorylation not accompanied by detectable FM4-64 internalization. Arrowheads in B and B′ point to stimulated synapses (shown at higher magnification in the insets) in which the intensity of staining for site 1-phosphorylated synapsin correlates with the intensity of FM4-64 labeling. Scale bar, 10 μm. C, Quantitative correlation between apparent stoichiometry of synapsin phosphorylation at site 1 (top) (r = 0.71; p < 0.001, Pearson's test) or total synapsin immunoreactivity (bottom) (r = −0.28; p > 0.1) and the level of FM4-64 uptake induced by depolarization. Each point corresponds to one synapse. The intensity of the labeling for phosphorylated synapsin is normalized for the total synapsin immunoreactivity in that terminal. A.U., Arbitrary units.
Figure 7.
Figure 7.
PKA-mediated synapsin phosphorylation at site 1 modulates SV recycling. A, Rat hippocampal neurons transfected to express either ECFP–SynI or ECFP–SynI S9A under the control of the CMV promoter were loaded with FM4-64 by exposure to 55 mm KCl for 1 min. The distribution of classes of FM4-64 fluorescence in ECFP fluorescent synapses is shown in the histograms with the corresponding color coding. p < 0.001 for ECFP–SynI versus ECFP–SynIS9A, Bonferroni's multiple comparison test (n = 300 synapses from 3 independent experiments). Mean ± SE values of FM4-64 uptake (n = 3 independent experiments) are shown in the insets. A.U., Arbitrary units. B, Rat hippocampal neurons transfected to express either ECFP–SynI or ECFP–SynI S9A under the CMV promoter were loaded with FM4-64 by exposure to 55 mm KCl for 1 min after a 30 min incubation with H89. A second epoch of FM4-64 uptake was induced by applying the same depolarizing stimulus 30 min after the washing out of H89 and bleaching of the residual fluorescence. FM4-64 was visualized exclusively in the synaptic boutons of the transfected neurons, selected using a digital masking system. The increase in FM4-64 uptake after removal of the PKA inhibition is prominent in synapses expressing ECFP–SynI (arrowheads), whereas it is partially inhibited in synapses expressing ECFP–SynI S9A (arrows). Scale bar, 4 μm. C, Quantitative analysis of FM4-64 uptake. p < 0.001 for KCl/H89 versus KCl for both chimeras and for ECFP–Syn I KCl versus ECFP–Syn I S9A KCl, Bonferroni's multiple comparison test (n = 200 synapses from 3 independent experiments).
Figure 8.
Figure 8.
Phosphorylation of synapsin at site 1 mostly accounts for the increase in SV recycling induced by PKA activation. Rat hippocampal neurons infected to express either ECFP–SynI or ECFP–SynI S9A under the CMV promoter were loaded with FM4-64 by exposure to 55 mm KCl for 30 s. A second epoch of FM4-64 uptake was induced by applying the same depolarizing stimulus after 20 min of recovery, followed by a 10 min incubation with forskolin (Forsk.) and bleaching of the residual fluorescence. The distribution of classes of FM4-64 fluorescence are shown (light gray, KCl; black, forskolin/KCl). p < 0.001 for neurons infected with vector before and after forskolin and for neurons expressing ECFP–SynI versus neurons expressing ECFP–SynI S9A both before and after forskolin; Bonferroni's multiple comparison test (n = 500 synapses from 3 independent experiments). Mean ± SE values of FM4-64 uptake (n = 3 independent experiments) are shown in the bottom. A.U., Arbitrary units.
Figure 9.
Figure 9.
Expression of SynI S9A impairs SV exocytosis in synapsin I knock-out neurons. Hippocampal neurons in culture from synapsin I knock-out mice infected to express either ECFP–SynI or ECFP–SynI S9A under the PGK promoter were loaded with FM4-64 using a depolarizing stimulus for 1 min. A, Distribution of classes of FM4-64 fluorescence are shown in the histograms with the corresponding color coding. p < 0.001 for ECFP–SynI versus ECFP–SynI S9A, Bonferroni's multiple comparison test (n = 300 synapses from 3 independent experiments). Mean ± SE values of FM4-64 uptake (n = 3 independent experiments) are shown in the inset. B, Before the depolarizing pulse, neurons were incubated for 30 min with 10 μm H89. A second epoch of FM4-64 uptake was induced by applying the same depolarizing stimulus 30 min after the washing out of H89 and bleaching of the residual fluorescence. The increase in FM4-64 uptake after removal of the PKA inhibition is prominent in synapses expressing ECFP–SynI, whereas it is partially inhibited in synapses either uninfected or expressing ECFP–SynI S9A. p < 0.001 for neurons treated with H89 (either uninfected or infected with either vector) versus the same neurons after recovery from PKA inhibition and for neurons infected with ECFP–SynI versus either uninfected or ECFP–SynI S9A-infected neurons, after recovery from PKA inhibition; Bonferroni's multiple comparison test (n = 300 synapses from 2 independent experiments). C, The kinetics of FM4-64 destaining elicited from a second depolarizing pulse was evaluated by acquiring a stack of images at 2 s intervals and analyzing the progressive decrease in fluorescence at single synaptic boutons. Values have been corrected for bleaching and normalized. The average ± SE fluorescence intensities of 32 synaptic boutons per sample from three independent experiments are shown. A.U., Arbitrary units.
Figure 10.
Figure 10.
Mutation of phosphorylation site 1 in synapsin affects the kinetics of synaptic depression and recovery in response to sustained high-frequency stimulation and impairs the response to activation or inhibition of the PKA pathway. Recordings were performed on hippocampal neurons (9–15 DIV) from synapsin I knock-out mice expressing either ECFP–SynI or ECFP–SynI S9A, in the absence (control conditions) or presence of either forskolin (50 μm) or H89 (5 μm). Black bars, ECFP–SynI under control conditions; dark gray bars, ECFP–SynI S9A under control conditions; light gray bars, ECFP–SynI after forskolin; white bars, ECFP–SynI S9A after forskolin; dotted bars, ECFP–SynI after H89; dashed bars, ECFP–SynI S9A after H89. A, Representative traces of eEPSC amplitude versus time recorded during repeated presynaptic stimulation at 0.1 Hz in neurons expressing either wild-type or mutated synapsin I. Addition of 50 μm forskolin causes a clear increase in current amplitude in both neurons. Traces of single eEPSCs taken at 50 and 350 s are shown in the inset. B, Mean ± SE eEPSC amplitude of samples treated as in A (9 < n <13 cells for the various experimental groups). C, Plot of the 15 first eEPSCs evoked by a stimulation train at 10 Hz. The postsynaptic response is expressed as percentage of the first eEPSC of the train. A representative postsynaptic response evoked by the train is shown in the inset. Depression is increased by forskolin, but no significant differences are detected between the two groups of neurons (9 < n <11 cells for the various experimental groups). D, Plot of the normalized mean ± SE eEPSC amplitude (14 < n < 16 cells for the various experimental groups) recorded before, during, and after a 1 min pulse of stimulation at 16 Hz. The basal frequency of stimulation was 0.1 Hz. A clear difference in the rate of recovery from depression can be detected between neurons expressing wild-type or mutated synapsin I. In E, the time course of depression of the samples shown in D is shown on an expanded scale and fitted with a double-exponential decay function. For clarity, only every 15th point is shown. F, Mean ± SE values of eEPSC amplitude at steady state (Iss) and of the time constants of the fast (τ1) and slow (τ2) decay components of the samples in E. The slow component is strongly accelerated in neurons expressing synapsin S9A and accounts for 23 ± 0.5% of the total decay (vs 11 ± 0.2% in neurons expressing wild-type synapsin I). G, H, Effects of forskolin and H89 on the time courses of recovery from depression induced by the protocol described in D. Recovery curves were fitted according to a monoexponential function. I, The mean ± SE values (7 < n < 16 cells for the various experimental groups) of the time constants of recovery under basal conditions are shown in the left. In the right, the percentage ± SE changes in the time constants observed after treatment with forskolin or H89 with respect to the control values are shown. Forskolin markedly accelerates and H89 markedly slows down recovery in neurons expressing wild-type synapsin I. Both treatments had smaller effects in neurons expressing the mutated protein. Statistical analysis was performed by using two-way ANOVA, followed by the Duncan's multiple comparison test (*p < 0.05 and **p < 0.01 forskolin or H89 vs respective control; Δp < 0.05 and ΔΔp < 0.01 forskolin vs H89; °°p < 0.01 SynI S9A vs SynI).

Similar articles

Cited by

References

    1. Baba T, Sakisaka T, Mochida S, Takai Y. PKA-catalyzed phosphorylation of tomosyn and its implication in Ca2+-dependent exocytosis of neurotransmitter. J Cell Biol. 2005;170:1113–1125. - PMC - PubMed
    1. Baldelli P, Hernandez-Guijo JM, Carabelli V, Carbone E. Brain-derived neurotrophic factor enhances GABA release probability and nonuniform distribution of N- and P/Q-type channels on release site of hippocampal inhibitory synapses. J Neurosci. 2005;25:3358–3368. - PMC - PubMed
    1. Banker GA, Cowan WM. Rat hippocampal neurons in dispersed cell culture. Brain Res. 1977;126:397–442. - PubMed
    1. Benfenati F, Bahler M, Jahn R, Greengard P. Interactions of synapsin I with small synaptic vesicles: distinct sites in synapsin I bind to vesicle phospholipids and vesicle proteins. J Cell Biol. 1989;108:1863–1872. - PMC - PubMed
    1. Betz WJ, Mao F, Smith CB. Imaging exocytosis and endocytosis. Curr Opin Neurobiol. 1996;6:365–371. - PubMed

Publication types

MeSH terms

LinkOut - more resources