Comparative Study
. 2006 Nov 8;26(45):11695-708.
doi: 10.1523/JNEUROSCI.2741-06.2006.

Cue-invariant networks for figure and background processing in human visual cortex

Affiliations
Comparative Study

Cue-invariant networks for figure and background processing in human visual cortex

L Gregory Appelbaum et al. J Neurosci. .

Abstract

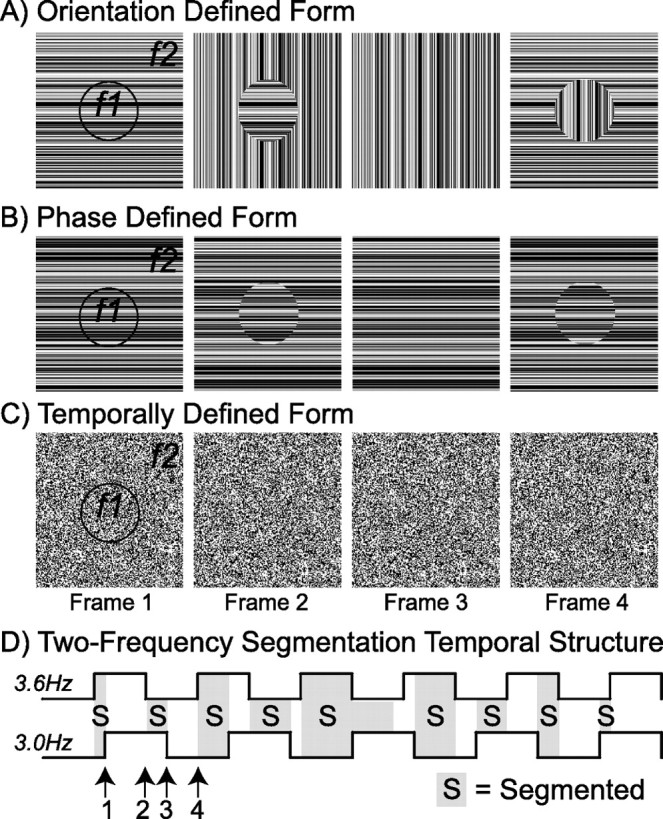
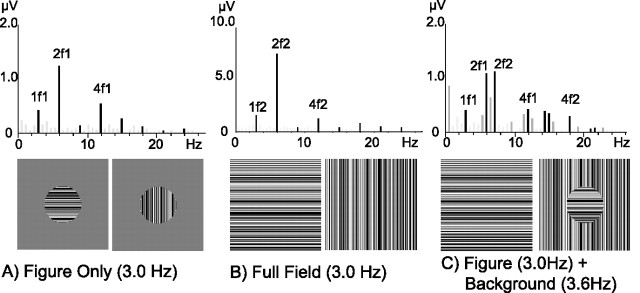
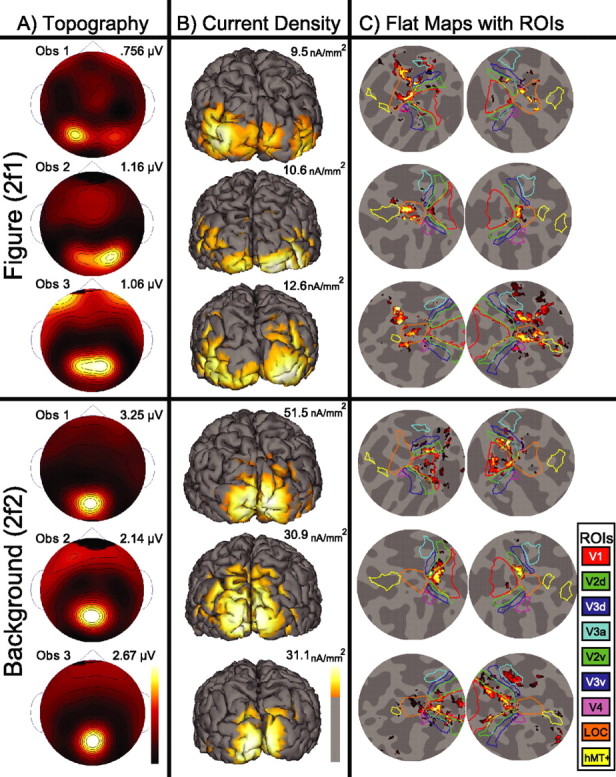
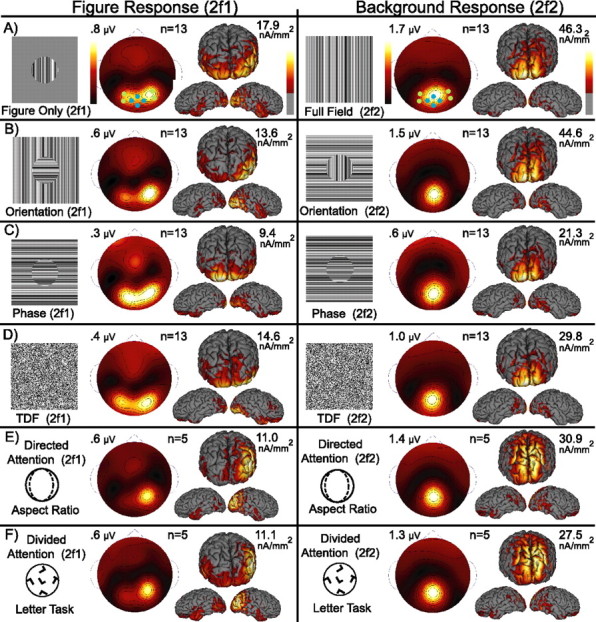
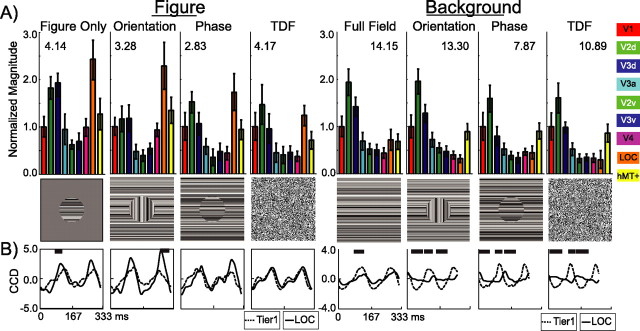
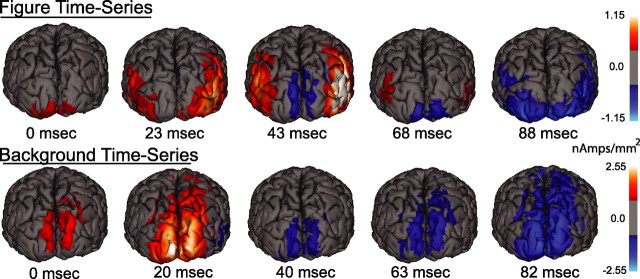
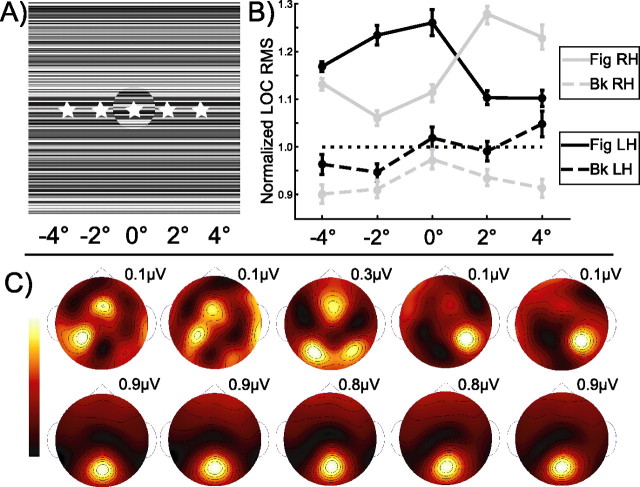
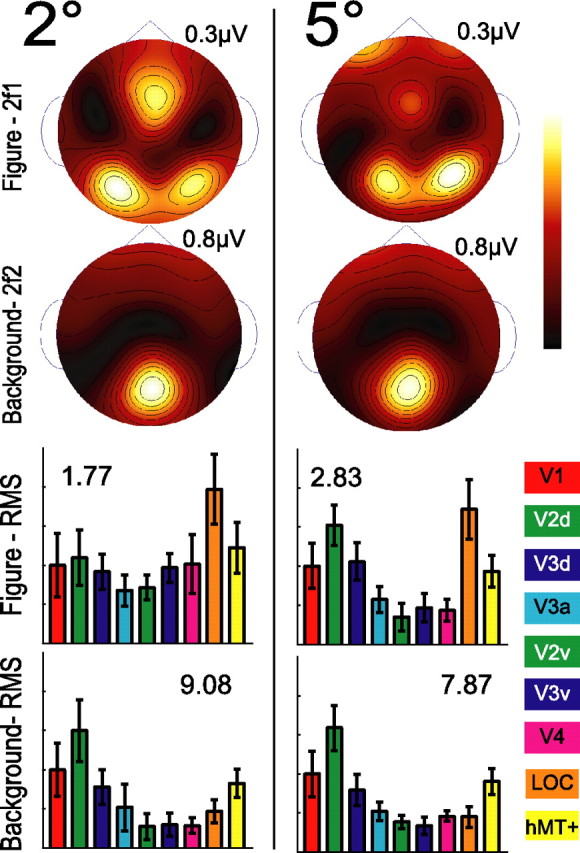
Lateral occipital cortical areas are involved in the perception of objects, but it is not clear how these areas interact with first tier visual areas. Using synthetic images portraying a simple texture-defined figure and an electrophysiological paradigm that allows us to monitor cortical responses to figure and background regions separately, we found distinct neuronal networks responsible for the processing of each region. The figure region of our displays was tagged with one temporal frequency (3.0 Hz) and the background region with another (3.6 Hz). Spectral analysis was used to separate the responses to the two regions during their simultaneous presentation. Distributed source reconstructions were made by using the minimum norm method, and cortical current density was measured in a set of visual areas defined on retinotopic and functional criteria with the use of functional magnetic resonance imaging. The results of the main experiments, combined with a set of control experiments, indicate that the figure region, but not the background, was routed preferentially to lateral cortex. A separate network extending from first tier through more dorsal areas responded preferentially to the background region. The figure-related responses were mostly invariant with respect to the texture types used to define the figure, did not depend on its spatial location or size, and mostly were unaffected by attentional instructions. Because of the emergent nature of a segmented figure in our displays, feedback from higher cortical areas is a likely candidate for the selection mechanism by which the figure region is routed to lateral occipital cortex.


Figures

Figure 1.
Figure 1.
Schematic illustration of three segmentation cues. Texture-defined stimuli composed of a central 5° figure region and a 21 ×21° background region were defined on the basis of periodic frequency tags applied to each region. In all conditions, the figure region was tagged at 3.0 Hz (f1) and the background region at 3.6 Hz (f2). Four characteristic frames are shown for each of three cues used to define figure/background segmentation in this experiment. A, Orientation-defined form in which the figure and background textures each changed orientation by 90°. B, Phase-defined form in which the textures alternated phase (180° rotation, flipping about the midline). C, Temporally defined form (TDF) in which random luminance square elements containing no orientation information were updated at the figure and background frequency tags. Additional control conditions (data not shown) consisted of an orientation modulating figure presented in isolation on a mean gray background (3.0 Hz) and a full field texture rotating by 90° at 3.6 Hz. D, A schematic representation of the temporal structure of figure segmentation over one full stimulus cycle (1.67 s). In this illustration, the states of the background (top square wave) and the figure (bottom square wave) are depicted by the solid lines. The sequence of figure segmentation resulting from these modulations is indicated by the shaded gray (segmented) and white (unsegmented) areas, with numbered arrows indicating the onset of individual frames (1–4), shown above.
Figure 2.
Figure 2.
Steady-state responses for three stimulus conditions. Amplitude spectra of one observer are depicted for a representative EEG sensor located over the response maxima [sensors 85 (A, C) and 75 (B) of the Geodesics HydroCell Sensor Net] for three stimulus conditions: figure-only (A), full field (B), and the orientation-defined form (C). Each amplitude spectrum is located over two frames of the stimulus from which it was obtained. SSVEP responses were present at integer multiples of the stimulus frequencies for each stimulus condition. Responses at harmonics of the stimulus frequencies are shown as darkened lines, with corresponding labels (nF1, figure-related; nF2, background-related). The figure-only stimulus condition (A) produced responses at integer multiples of the figure frequency tag (3.0, 6.0, 9.0 Hz…). Responses to the full field stimulus condition (B) were present at the harmonics of the full field frequency tag (3.0, 6.0, 9.0 Hz…). The amplitude spectrum resulting from the orientation-defined form stimulus (C) contained responses at harmonics of both the figure (3.0, 6.0, 9.0 Hz…) and the background (3.6, 7.2, 10.8 Hz…) tags as well as at low-order sums and the difference of these two frequencies (0.6, 6.6 Hz…).
Figure 3.
Figure 3.
Scalp topography, CCD, and flattened cortical maps with visual area ROIs. SSVEP responses at the second harmonic of the figure (6.0 Hz) and background regions (7.2 Hz) are shown for three observers. Figure responses are shown in the top three panels, and background responses are shown in the bottom three panels. Responses are displayed in separate columns as spline-interpolated scalp voltage topographies (A), cortically constrained current density (B), and CCD projected onto flattened representations of the left and right hemispheres with visual area ROIs (C). Individual map maxima are indicated above the color scale. A, Figure responses show a lateral distribution over occipital sensors in all three participants. In contrast, background responses are focused tightly over midline occipital sensors. Background responses are two to three times larger than figure responses. B, Figure-related CCD distributions extended medially from first tier areas across the ventral surface of all three observers' cortices. Background-related current density was focused mostly on the occipital pole and extended along the dorsal midline. C, To assist in visualizing the CCD maps, we show flattened perspectives of each observer's left and right hemispheres in the far right columns. Visual area outlines are illustrated on each flat map, with the color corresponding to the legend on the right. Figure-related responses in all hemispheres are localized within the LOC ROI, whereas background-related responses are distributed across the V1, V2, and V3 ROIs.
Figure 4.
Figure 4.
Group-averaged responses for the figure (2f1) and background (2f2) are shown for each of the four cue types (A–D) and two attention conditions (E, F). Topographies and current density estimates are shown as 13 subject grand averages for the second harmonic of the figure on the left and the background on the right. Figure responses are lateralized over the occipital cortex for all cues and attention conditions. Background responses are focused on the midline pole and are similar for all cue types and attention conditions. A schematic illustration of each stimulus, the number of observers included in the average, and the response maximum are included for each response distribution. The seven channel locations (Electrical Geodesics HydroCell Sensor Net, channels 59, 65, 71, 72, 75, 76, 90, 91) used to test sensor map differences are superimposed on the two-dimensional maps for the figure-only and full field. They are coded blue for the medial channels (Oz) and green for the lateral channels (P7 and P8).
Figure 5.
Figure 5.
Group average visual area response magnitudes and time courses. Figure-related (left) and background-related (right) responses are shown as the normalized magnitudes (A) and waveforms (B). Responses are grouped by stimulus condition, with one stimulus frame included in the center row for reference. Response magnitudes are displayed separately for each visual area (V1, red; V2, green; V3, blue; V3a, cyan; V4 magenta; MT+, yellow; LOC, orange). Error bars indicate 1 ± SEM. A, V1 normalized responses to the figure were maximal in the LOC ROI, whereas responses to the background were maximal in V2d and V3d ROIs. B, Average time courses for the Tier 1 ROI (dashed) and LOC ROI (solid) are plotted over one cycle of the figure and background stimulus cycles. The figure-related response in the Tier 1 ROI leads the larger response in the LOC ROI by ∼40 ms for the figure-only, orientation-defined form, and phase-defined form. Tier 1 and LOC also can be disassociated in the background response in which Tier 1 leads LOC and is of greater magnitude, although this difference is minimal in the full field condition, where there is no figure region.
Figure 6.
Figure 6.
Cortical distribution of figure and background responses over time. Average spatiotemporal maps derived from figure region (top) and background region (bottom) waveforms are presented as still frames on one observer's cortical surface for the orientation-defined form condition. Individual maps are thresholded at one-third of the maximum (gray) and are presented from a posterior perspective. The images are from time points during the respective stimulus periods that illustrate, qualitatively, the primary differences in cortical current distribution. The evolution of activity attributed to the figure progresses from first tier areas, located on the occipital pole, ventrally to lateral portions of the occipital cortex. Current density diminishes and then returns with the opposite polarity. In contrast, the background activity extends along the dorsomedial portion of the occipital cortex. The fact that these activity maps differ in their space/time distribution suggests that there are distinct cortical generators underlying figure and background processing. See the supplemental material for full animations (available at www.jneurosci.org).
Figure 7.
Figure 7.
Test of spatial invariance. A, So that the influence of spatial position on cortical responses could be evaluated, a 2° phase-defined form stimulus was viewed as participants fixated on one of five fixation points (indicated with stars) spaced at 2° intervals across the horizontal midline (note that the actual stimulus extends to 21 × 21°). B, Figure (solid) and background (dashed) response values from the LOC ROI are shown separately for the left (dark) and right (light) hemispheres at each fixation location. The LOC ROI displays considerable contralateralization. When the figure falls in the left visual field, figure responses are largest in the right LOC ROI; conversely, when the figure falls in the right visual field responses are largest in the left LOC ROI. Within a hemifield, the response magnitudes differ by 6 and 3% (relative to the maximum) for the left and right hemispheres, respectively. The background responses mostly are unaffected by the fixation location. C, Spline-interpolated scalp voltage topographies are shown for the second harmonic of the figure (top) and background (bottom) at each fixation location.
Figure 8.
Figure 8.
Test of size invariance. To evaluate the influence of region size on figure response, we compare region responses for the centrally presented 2° phase-defined form (left) with the 5° phase-defined form (right) stimulus of the main experiment. Similar response distributions and ROI magnitude profiles are present in the figure and background responses for each stimulus configuration. Error bars show the SEM across observers and hemispheres calculated according to Equation 2.

References

    1. Bevington PR, Robinson DK. New York: McGraw-Hill; 1992. Data reduction and error analysis for the physical sciences.
    1. Blair RC, Karniski W. An alternative method for significance testing of waveform difference potentials. Psychophysiology. 1993;30:518–524. - PubMed
    1. Brewer AA, Liu J, Wade AR, Wandell BA. Visual field maps and stimulus selectivity in human ventral occipital cortex. Nat Neurosci. 2005;8:1102–1109. - PubMed
    1. Caputo G, Casco C. A visual evoked potential correlate of global figure-ground segmentation. Vision Res. 1999;39:1597–1610. - PubMed
    1. Casco C, Grieco A, Campana G, Corvino MP, Caputo G. Attention modulates psychophysical and electrophysiological response to visual texture segmentation in humans. Vision Res. 2005;45:2384–2396. - PubMed

Publication types

MeSH terms

LinkOut - more resources